


TA: Bitcoin Price Could Rally If There Is A Close Above This Key Resistance

Bitcoin price remained supported above the $22,650 level against the US Dollar. BTC could rally if there is a clear move above the $23,500 resistance zone.
- Bitcoin is trading in a range above the $22,500 level the $23,500 level.
- The price is now trading above the $23,000 level and the 100 hourly simple moving average.
- There was a break above a key bearish trend line with resistance near $23,200 on the hourly chart of the BTC/USD pair (data feed from Kraken).
- The pair must clear the $23,500 resistance to start a steady increase in the near term.
Bitcoin Price Faces Key Barrier
Bitcoin price remained above a major support zone near the $22,400 and $22,500 levels. The price started a decent increase above the $22,800 and $22,950 levels.
The upward move was such that the price climbed above the $23,000 level and the 100 hourly simple moving average. The price surpassed the 50% Fib retracement level of the downward move from the $23,477 swing high to $22,755 low.
Besides, there was a break above a key bearish trend line with resistance near $23,200 on the hourly chart of the BTC/USD pair. The pair is now trading near the $23,300 level.
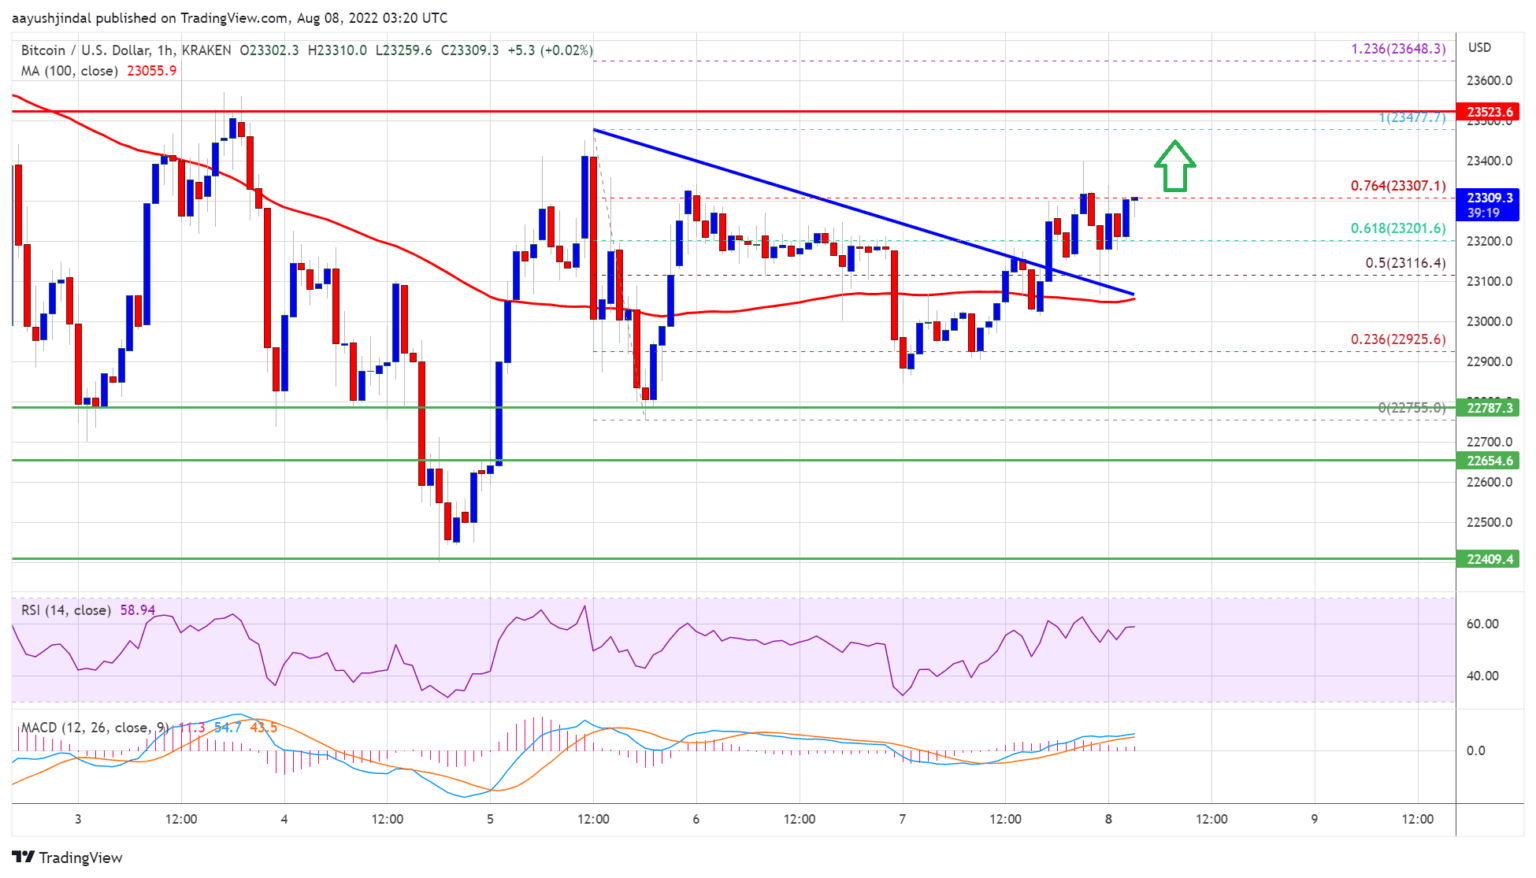
Source: BTCUSD on TradingView.com
It is struggling near the 76.4% Fib retracement level of the downward move from the $23,477 swing high to $22,755 low. The next key resistance is near the $23,500 zone. A close above the $23,500 resistance zone could start a steady increase. In the stated case, the price may perhaps rise clear the $24,500 resistance.
Downside Break in BTC?
If bitcoin fails to clear the $23,500 resistance zone, it could start a downside correction. An immediate support on the downside is near the $23,100 level.
The next major support now sits near the $22,750 level. A close below the $22,750 level might start a move towards $22,500. Any more losses might send the price towards $22,000 level.
Technical indicators:
Hourly MACD – The MACD is now gaining pace in the bullish zone.
Hourly RSI (Relative Strength Index) – The RSI for BTC/USD is now above the 50 level.
Major Support Levels – $23,100, followed by $22,750.
Major Resistance Levels – $23,500, $24,200 and $24,500.


 Bitcoin
  Ethereum
  Tether
  USDC
USDC  Dogecoin
  Cardano
  Bitcoin Cash
  Polygon
  Litecoin
  LEO Token
  Cosmos Hub
  Stellar
  OKB
OKB  Hedera
  Maker
Maker  Algorand
  NEO
NEO  Synthetix Network
  Gate
Gate  KuCoin
  IOTA
IOTA  Tether Gold
  TrueUSD
  Enjin Coin
  0x Protocol
  Holo
Holo  Ravencoin
  Siacoin
  Ontology
  Basic Attention
  Decred
  Zcash
Zcash  Lisk
Lisk  Waves
Waves  DigiByte
  Numeraire
  Status
  Nano
Nano  Pax Dollar
  Steem
Steem  OMG Network
  BUSD
BUSD  Ren
Ren  Bytom
Bytom  Bitcoin Diamond
  HUSD
HUSD  Energi
  Augur
Augur