


This 11-Year-Old Bitcoin Indicator Shows Reversal Ahead: Details

One of the most popular and time-tested indicators in technical analysis, the Relative Strength Index, is showing many signs of an upcoming bounce for Bitcoin as the first cryptocurrency is trading around extremely low values for the last few months.
The two-week chart of the cryptocurrency allows us to see the 11-year-old RSI channel, which has been tested at least four times and acted as an accurate tool for determining local reversal points.
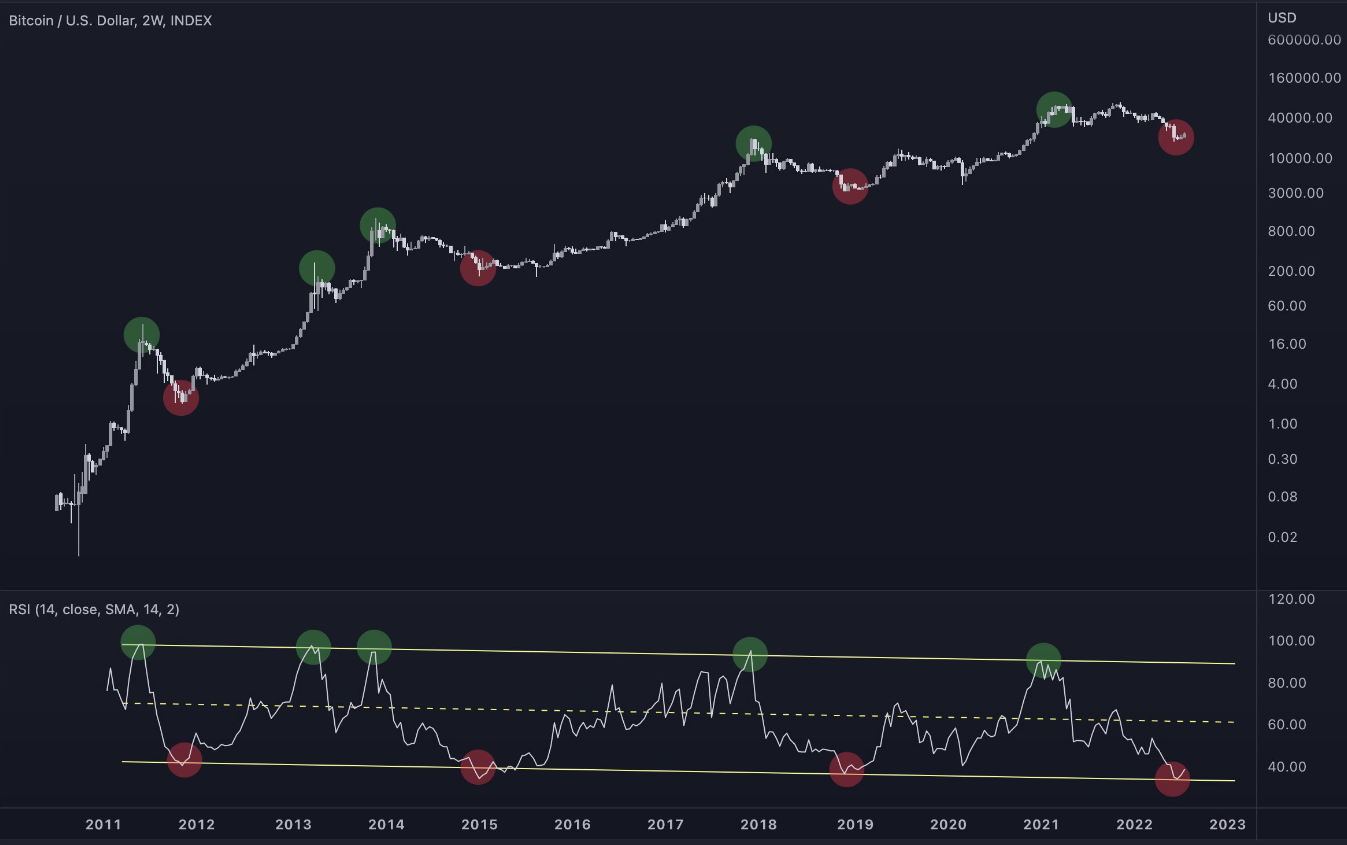
Thanks to the channel, back in 2019, we saw the beginning of the biggest uptrend on the market when BTC reached its current ATH of $69,000. The channel also worked in the opposite way, allowing us to see almost the exact point of the reversal and the end of the uptrend.
The Relative Strength Index is a tool that helps investors to determine when an asset is overbought or oversold by comparing the price movement with various moving averages. By determining an asset’s state, investors can adjust their position entries and set targets accordingly.
Can RSI be trusted today?
The indicator remains one of the most accurate tools in technical analysis, considering the fact that it successfully determined the most recent reversal on the market. Unfortunately, the fact that Bitcoin is going to bounce around this price does not necessarily mean that we are going to see a full reversal.
RSI only signals that the asset is heavily overbought or oversold, which means that it might start moving in the opposite direction, but it does not mean that it will become overbought at some point.
As for today, Bitcoin is showing some signs of a short-term bounce on one side and a lack of trading volume and constant inflows on the other.


 Bitcoin
  Ethereum
  Tether
  USDC
USDC  Dogecoin
  Cardano
  Bitcoin Cash
  Polygon
  Litecoin
  LEO Token
  OKB
OKB  Stellar
  Cosmos Hub
  Hedera
  Maker
Maker  Algorand
  NEO
NEO  Synthetix Network
  Gate
Gate  KuCoin
  IOTA
IOTA  Tether Gold
  TrueUSD
  Enjin Coin
  0x Protocol
  Ravencoin
  Holo
Holo  Siacoin
  Basic Attention
  Decred
  Zcash
Zcash  Ontology
  Lisk
Lisk  Waves
Waves  DigiByte
  Numeraire
  Status
  Nano
Nano  Pax Dollar
  Steem
Steem  OMG Network
  BUSD
BUSD  Ren
Ren  Bitcoin Diamond
  Bytom
Bytom  HUSD
HUSD  Energi
  Augur
Augur