


Trader Who Called May 2021 Bitcoin Crash Says BTC Flashing Strong Bottom Signals, Predicts Short-Term Rally

The analyst who called the May 2021 Bitcoin (BTC) collapse and the double top pattern at $69,000 now thinks BTC’s chart looks optimistic.
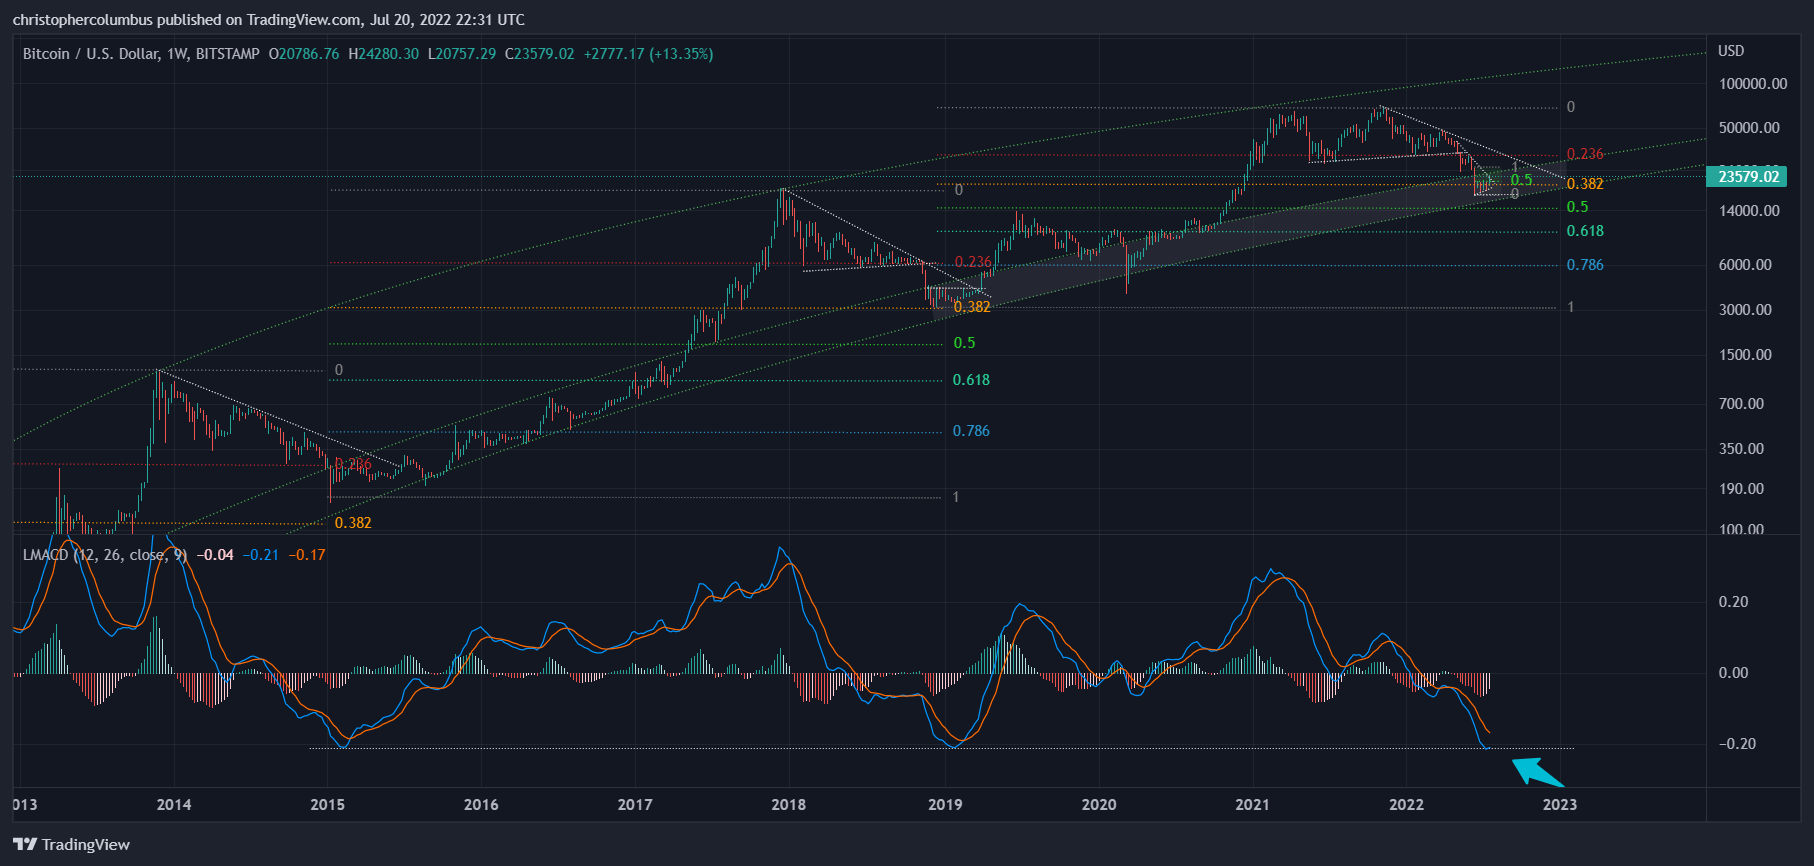
Pseudonymous analyst Dave the Wave tells his 121,500 Twitter followers that Bitcoin’s weekly moving average convergence divergence (MACD) indicator is flashing a strong bottom signal.
“The worm has turned on the weekly MACD. Just coincidence… or technical analysis?”
Source: davthewave/Twitter
Traders use the MACD to spot possible trend reversals. Looking at the trader’s chart, Bitcoin’s weekly MACD appears to be rising at a level that has marked the bottom of the 2015 and 2018 bear markets.
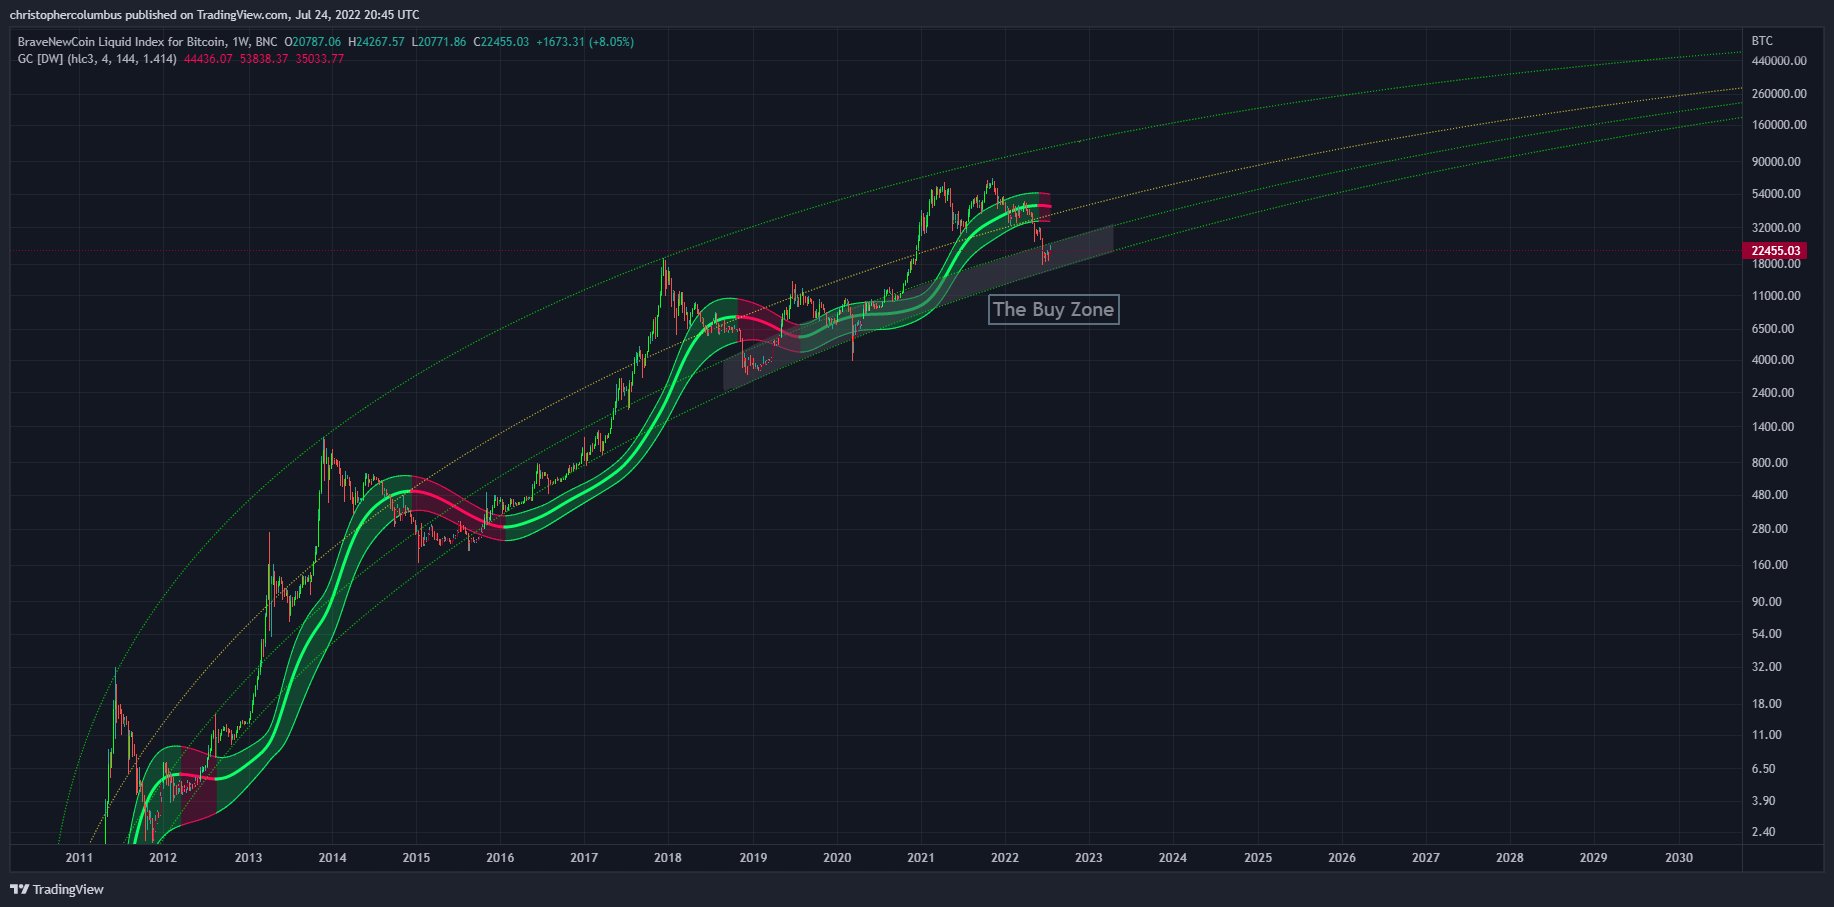
On top of a recovering MACD, Dave the Wave also says he’s optimistic about Bitcoin’s price chart as BTC is currently hovering at an area of long-term support.
“Why have some confidence in this Bitcoin chart? Realism and continuity…. as opposed to continually projecting a hyper-bull outlook onto the chart. Looking good.”
Source: davthewave/Twitter
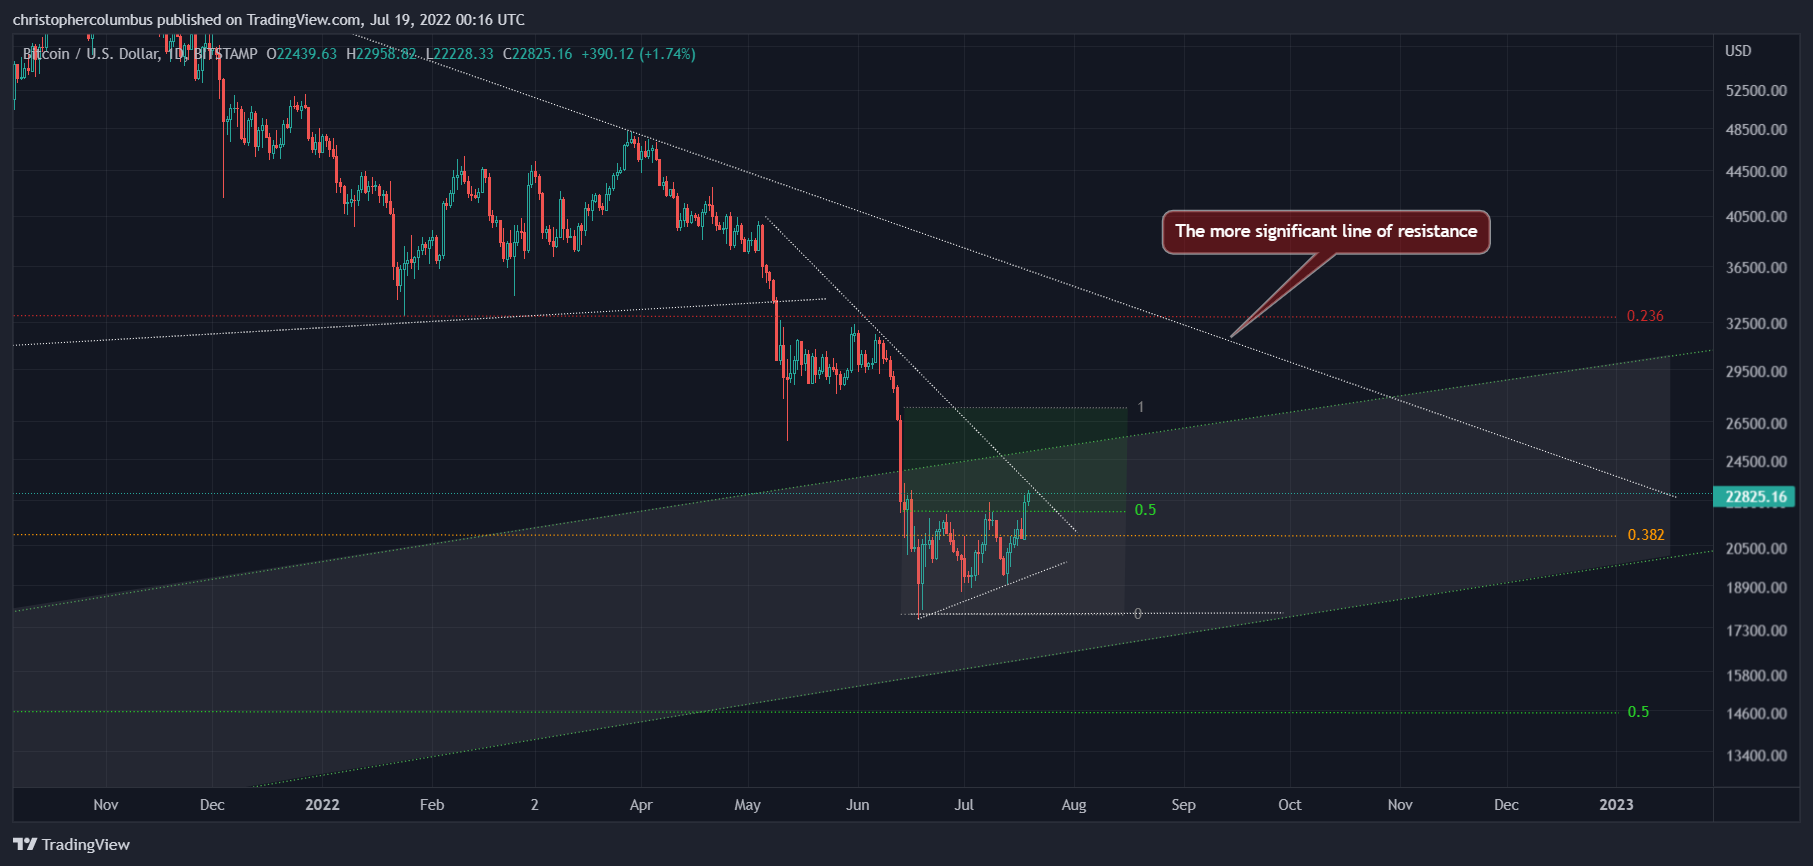
Looking at the daily chart, the crypto analyst says BTC is facing a pair of diagonal resistances.
“Currently meeting short-term resistance, which is not much resistance at all, in my opinion. It’s the longer-term second line of resistance that’s more significant, in my opinion.”
Source: davthewave/Twitter
BTC is trading for $21,015 at time of writing. The top-ranked crypto asset by market cap is down more than 6% in the past 24 hours. Bitcoin also remains down nearly 70% from its all-time high, which it hit last November.


 Bitcoin
  Ethereum
  Tether
  USDC
USDC  Dogecoin
  Cardano
  Bitcoin Cash
  Polygon
  Litecoin
  LEO Token
  OKB
OKB  Stellar
  Cosmos Hub
  Hedera
  Maker
Maker  Algorand
  NEO
NEO  Synthetix Network
  Gate
Gate  KuCoin
  IOTA
IOTA  Tether Gold
  TrueUSD
  Enjin Coin
  0x Protocol
  Ravencoin
  Holo
Holo  Siacoin
  Basic Attention
  Decred
  Zcash
Zcash  Ontology
  Waves
Waves  Lisk
Lisk  DigiByte
  Numeraire
  Status
  Nano
Nano  Pax Dollar
  Steem
Steem  OMG Network
  BUSD
BUSD  Ren
Ren  Bitcoin Diamond
  Bytom
Bytom  HUSD
HUSD  Energi
  Augur
Augur