


TRON Price Analysis: The TRX Price Facing a Downtrend, Calling Bulls for Help

- Following a comeback, the TRX price has begun to decline once more, with the traditional cryptocurrency BTC dominating the daily price chart.
- The technical indicators over the daily price chart appear to be in favor of the bears this time,
- The TRX/BTC pair is at 0.00000298 BTC with a gain of 3.49%.
The TRX price after a recovery has started falling again as dominated by the traditional cryptocurrency BTC, over the daily price chart. This shows the bears are getting back in power and are smashing the recovery back. The investors need to take care as the market is being uncertain these days.
The trading volume is at a decline of 15% and still sinking, this should be a matter of concern for the bulls. The coin needs to attract buyers to save the bulls efforts and if the the situation persists the coin can fall below the support level of $0.061 which would be a difficult situation for the bulls to make the coin recover, so it’s the time for the bulls to take over the control and take the price to the uptrend movement again.
The price for TRX coin is currently trading at $0.067 with a loss of 2.99% in its market capitalization in the last 24 hrs. The coin has a trading volume of 559 million which is at a loss of 15.53% in the 24 hrs trading session and has a market cap of 6.1 billion. The volume market cap ratio of TRX is 0.0902.
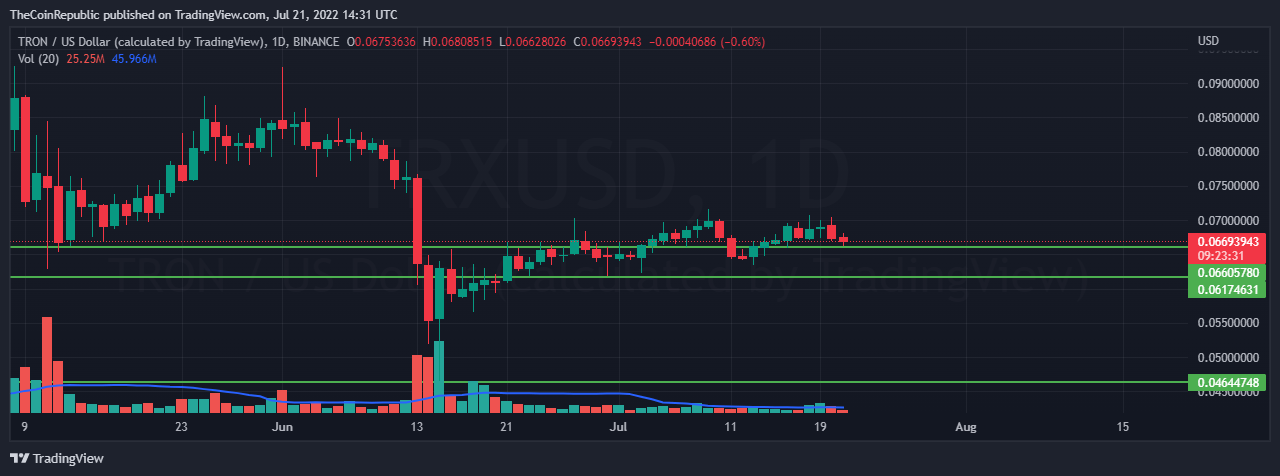
Source: TRX/USD by tradingview
What do Technical Indicators Suggest for TRX
The volume is still moving below average on the daily time frame. The bulls need to take this to the right track.
The MACD indicator displays the MACD line is moving above the MACD signal line and is approaching for a negative crossover, along with the fading green histograms. The relative strength index is diving amid the bearish pressure over the daily price chart which needs to be fixed or else the coin may suffer a collapse, which will be difficult situation for the bulls.
ALSO READ – Blockchain.com Laid Off 25% of Its Staff
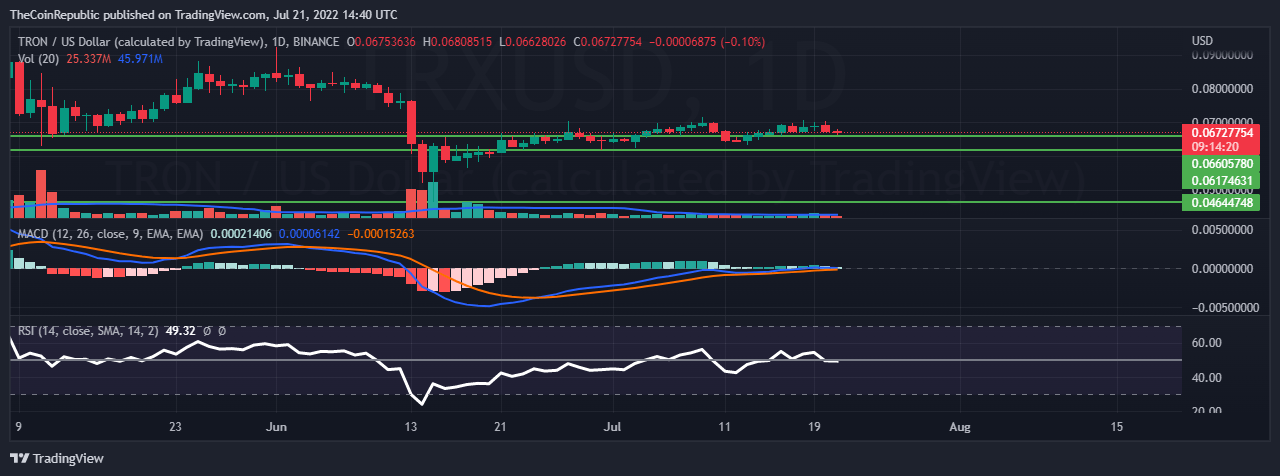
Source: TRX/USD by tradingview
Conclusion
The TRX price after a recovery has started falling again as dominated by the traditional cryptocurrency BTC, over the daily price chart.The coin needs to attract buyers to save the bulls efforts and if the situation persists the coin can fall below the support level of $0.061. While looking over the technical indicators we can observe the domination of sellers over the daily price chart which needs to be fixed by the bulls or else we can witness a negative croo over the MACD indicators.
Technical levels
Resistance levels: $0.071 and $0.078
Support levels: $0.0640 and $0.0590
Disclaimer
The views and opinions stated by the author, or any people named in this article, are for informational ideas only, and they do not establish the financial, investment, or other advice. Investing in or trading crypto assets comes with a risk of financial loss.


 Bitcoin
  Ethereum
  Tether
  USDC
USDC  Dogecoin
  Cardano
  Bitcoin Cash
  Polygon
  Litecoin
  LEO Token
  OKB
OKB  Cosmos Hub
  Stellar
  Hedera
  Maker
Maker  Algorand
  NEO
NEO  Synthetix Network
  Gate
Gate  KuCoin
  IOTA
IOTA  Tether Gold
  TrueUSD
  Enjin Coin
  0x Protocol
  Ravencoin
  Holo
Holo  Siacoin
  Basic Attention
  Ontology
  Zcash
Zcash  Decred
  Waves
Waves  Lisk
Lisk  DigiByte
  Numeraire
  Status
  Nano
Nano  Pax Dollar
  Steem
Steem  OMG Network
  BUSD
BUSD  Ren
Ren  Bitcoin Diamond
  Bytom
Bytom  HUSD
HUSD  Energi
  Augur
Augur