


TRON TOKEN PRICE ANALYSIS: TRON Token Price Seems Ready For A Big Move, Will It Break Out Of The Narrow Range Or Continue To Trade In It?

- TRX token price is trading in a small narrow range as it nears the supply zone on a daily time frame.
- The TRX token price is forming higher huh and higher low formation on a daily time frame.
- The pair of TRX/BTC is trading at the price level of 0.0000267 with a decrease of -0.67% in the last 24 trading hours.
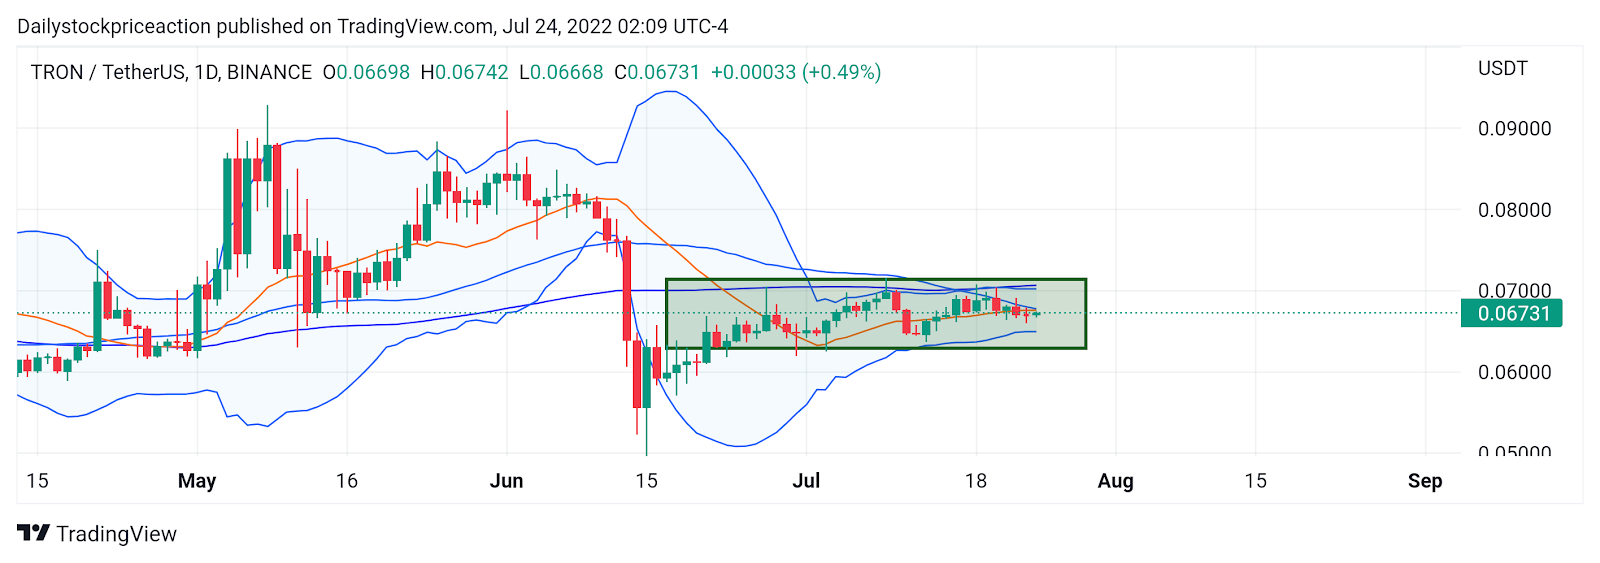
Source: TRX/USDT by tradingview
TRON token price is trading in a very small narrow range on a daily time frame. The token started forming higher high and higher low formations on a daily time frame. But recently the price movement took that and started moving in a range. This indicates a massive mine in the upcoming trading days on the breakout side. At present, the TRX token price is trading in the middle of the Bollinger band indicator. Recent bullishness in the price of TRX tokens has led to the token bouncing off the lower band of the Bollinger band indicator. The TRX town price has given a breakout of 14 SMA. As of now, the TRX token price is trading above it. At present, the TRX token is trading below the important Moving average of 50 and 100. The token price tried to give a breakout of the important moving average but failed to do so. Moving forward the token can face rejection of the Important Moving Average which can push the price down. Volumes have been normal as the token consolidates.
TRX token price has bounced off the demand zone on an hourly time frame
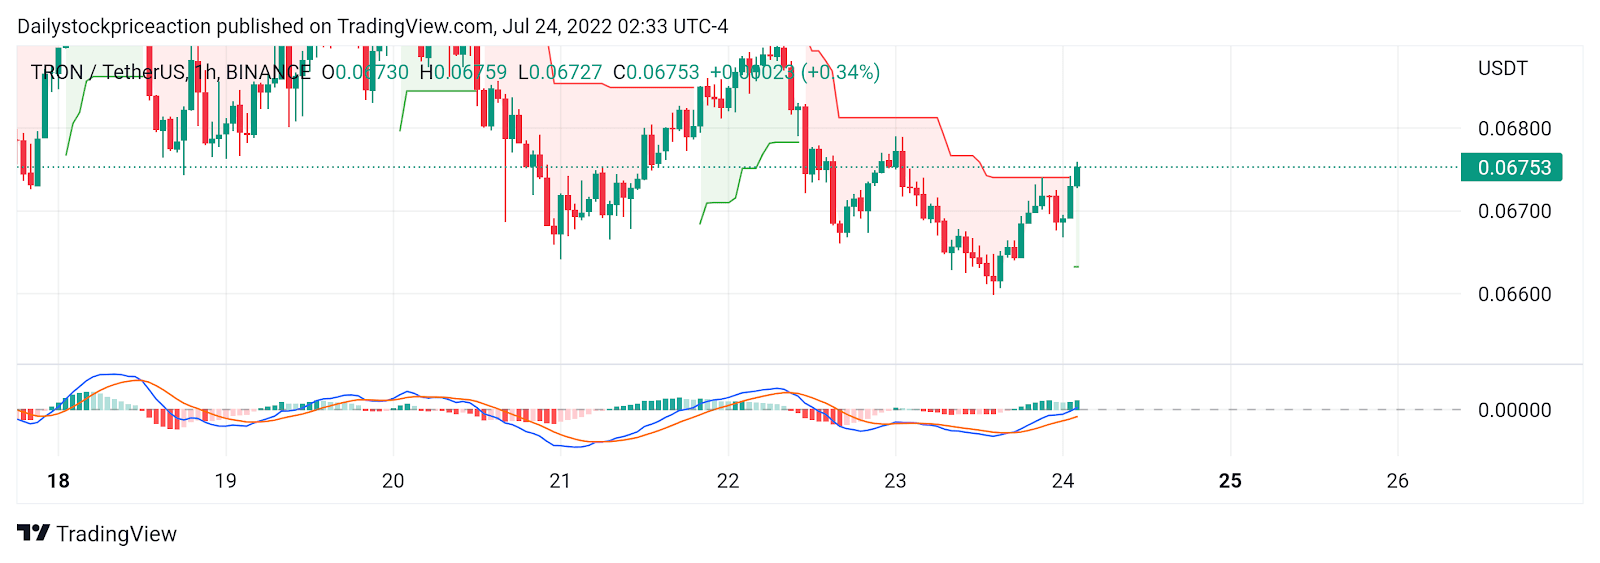
Source: TRX/USDT by tradingview
Supertrend: TRX token price is forming higher high and higher low formation on an hourly time frame. There can be bullish momentum once the TRX token price crosses the supply zone. As of now, the token price has crossed the super trend sell signal line on an hourly time frame, but the candle is yet to close. Once the candle closes above the super trend sell line, the super trend indicator can be seen giving a buy signal.
Moving Average Convergence Divergence: MACD indicator gave positive crossover recently as the token price bounced off the short-term demand zone. The blue line crossed the orange line on the upside indicating bullish momentum. Once the TRX token price crosses the short-term supply zone of $0.06800, the gap between the MACD line can be seen widening supporting the trend.
TRON token price is forming a symmetrical triangle pattern on a weekly time frame
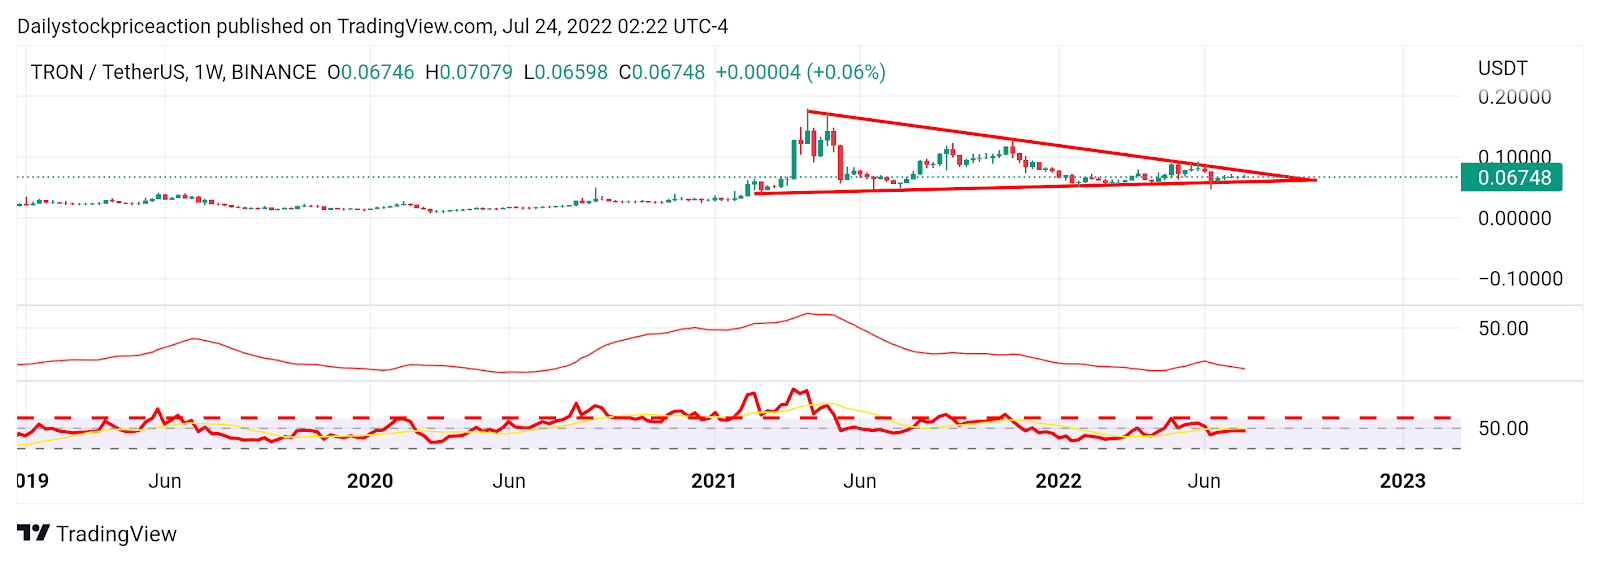
Source: TRX/USDT by tradingview
TRON token price is forming a symmetrical triangle pattern on a daily time frame as the price action suggests.
Average Directional Movement Index: ADX curve has been dipping as the token price continues to fall. ADX curve has slipped below the 20 mark. The ADX curve is still downward sloping as the token price falls on a higher time frame. For the TRX token price to break the supply zone, the ADX curve needs to come out of the 20 levels and start moving upwards.
Relative Strength Index: RSI curve is trading at the level of 47, below the halfway mark of 50. The RSI curve has crossed the 20 EMA indicating short-term bullishness. For the TRX token to break out of the supply zone RSI curve needs to cross the halfway mark of 50.
CONCLUSION: TRX token price is trading in a small range of the n daily time frames, while on a larger time frame the token is forming a bullish reversal chart pattern. The technical parameters are also bullish as the token price continues to move higher. It remains to see if the token price breaks the supply zone or faces rejection of it.
SUPPORT: $0.065 and $0.067
RESISTANCE: $0.072 and $0.074


 Bitcoin
  Ethereum
  Tether
  USDC
USDC  Dogecoin
  Cardano
  Bitcoin Cash
  Polygon
  Litecoin
  LEO Token
  Cosmos Hub
  Stellar
  OKB
OKB  Hedera
  Maker
Maker  Algorand
  NEO
NEO  Synthetix Network
  Gate
Gate  KuCoin
  IOTA
IOTA  Tether Gold
  TrueUSD
  Enjin Coin
  0x Protocol
  Holo
Holo  Ravencoin
  Siacoin
  Ontology
  Basic Attention
  Decred
  Zcash
Zcash  Lisk
Lisk  Waves
Waves  DigiByte
  Numeraire
  Status
  Nano
Nano  Pax Dollar
  Steem
Steem  OMG Network
  BUSD
BUSD  Ren
Ren  Bytom
Bytom  Bitcoin Diamond
  HUSD
HUSD  Energi
  Augur
Augur