


Will Bitcoin Price (BTC/USD) Be Trading Sideways?
Relevance up to 09:00 2022-08-23 UTC+2 Company does not offer investment advice and the analysis performed does not guarantee results. The market analysis posted here is meant to increase your awareness, but not to give instructions to make a trade.
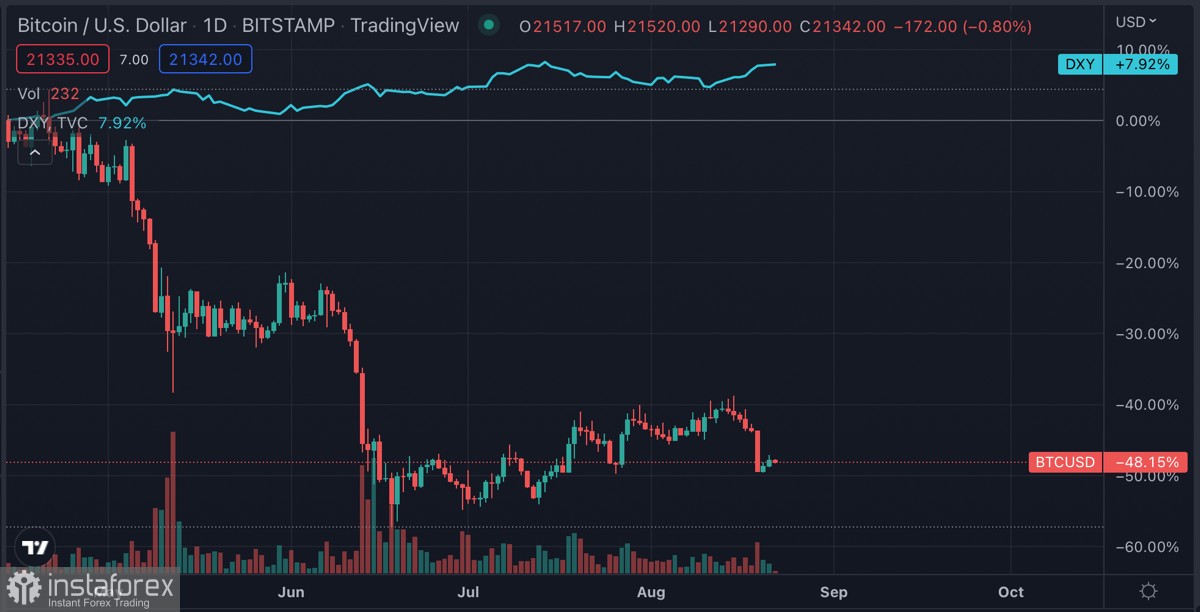
Bitcoin has completed a sluggish upward trend that originated after the formation of the local market bottom. The price has pulled back to the $21k–$22k level, where a large cluster of long-term investors accumulating Bitcoins are concentrated. The upward movement of the cryptocurrency was built around illusory desires to see a $30k retest and start a new stage of recovery. However, if you look at the weekly chart of the cryptocurrency, it becomes clear that the upward trend of the asset until mid-August looked very unconvincing.
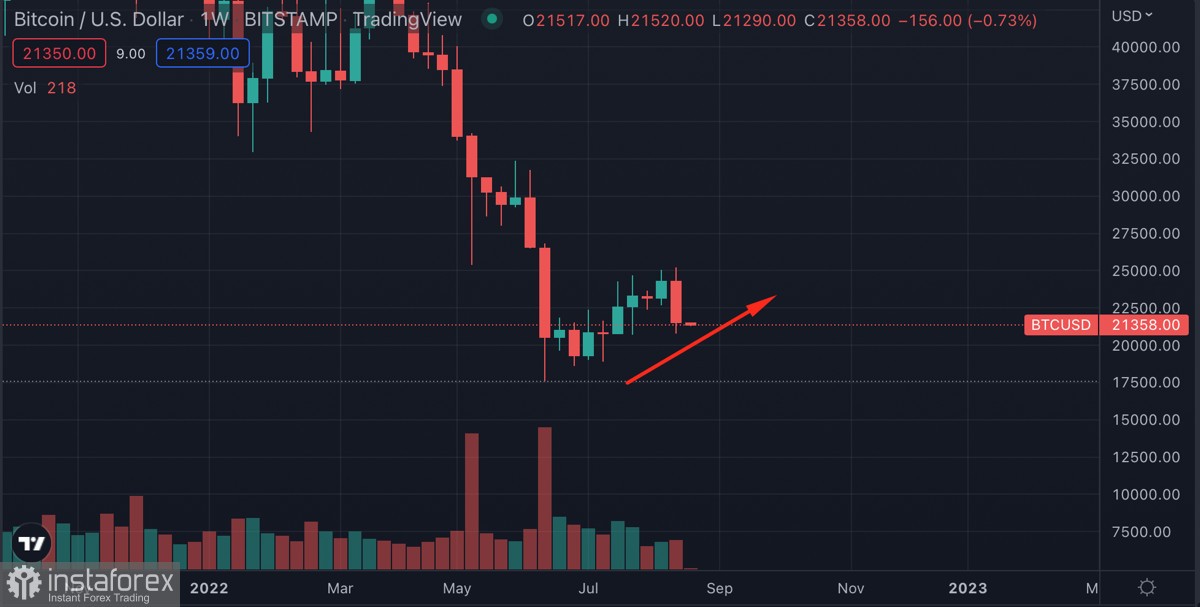
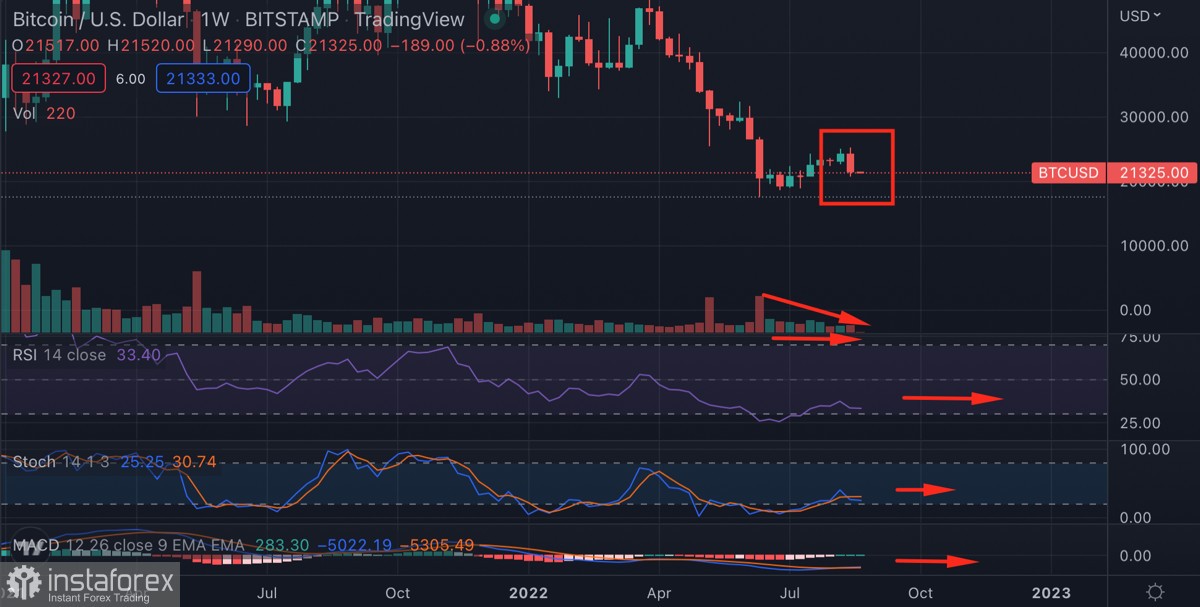
On the weekly chart, Bitcoin has formed a «bearish engulfing» pattern, which indicates that the downward momentum will continue in the near term. However, judging by the trading volumes, this pattern was formed due to a decrease in overall trading activity, and buyers in particular. Despite the negative end of the previous week, technical indicators in the weekly perspective point to price consolidation rather than the second stage of a major fall. The Stochastic and the RSI are moving flat, as is the MACD moving below zero. Technical metrics indicate that Bitcoin has no reason to start a powerful upward trend in the medium term.
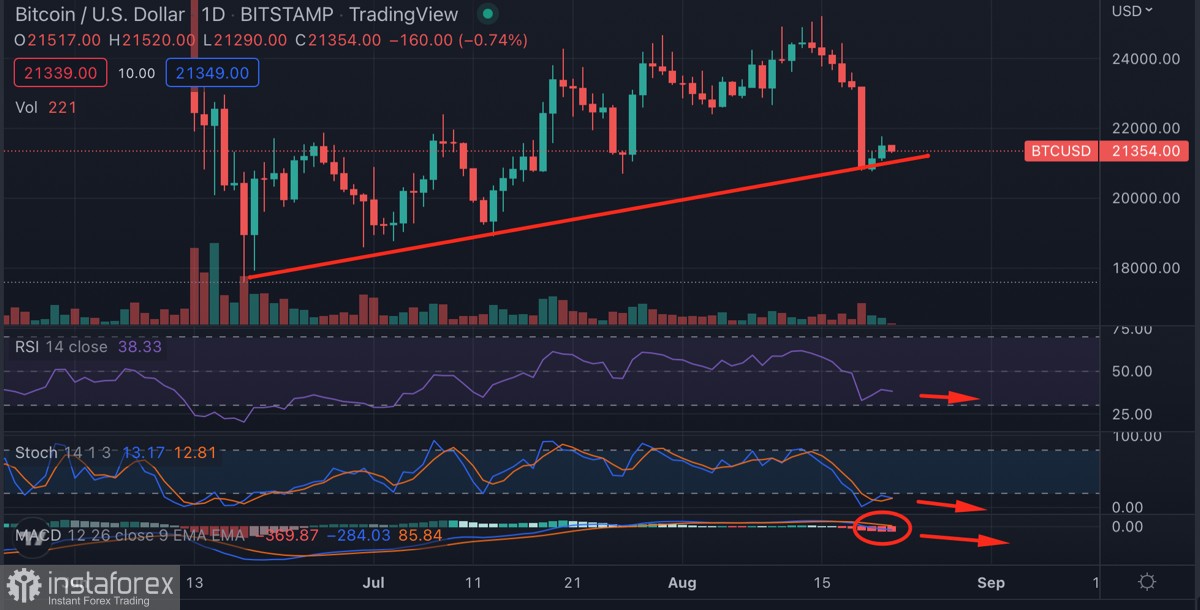
On the daily chart, the situation is somewhat more complicated. Despite a sharp recovery from the fall, technical metrics hint at a likely second stage of decline. In particular, the stochastic oscillator was falling to the overbought zone, where it tried to reverse. However, in the end, the metric completes the implementation of another bearish crossover. The RSI also starts to drop below 40, indicating growing selling volumes. The MACD indicator also enters the red zone and moves below the zero mark. These factors indicate the predominance of sellers at the current stage, and hence the continuation of the downward price trend.
As a result, the US dollar index, which has an inverse correlation with Bitcoin, has significantly strengthened. However, this factor may be overestimated due to the overall macroeconomic environment. Investors are in the process of developing an acceptable trading strategy that will allow them to capitalize in an environment of high inflation and the risk of stagflation. This is the reason for the low trading volumes. However, there is no doubt that an investment strategy will be developed, and the deflationary potential of Bitcoin will play an important role.
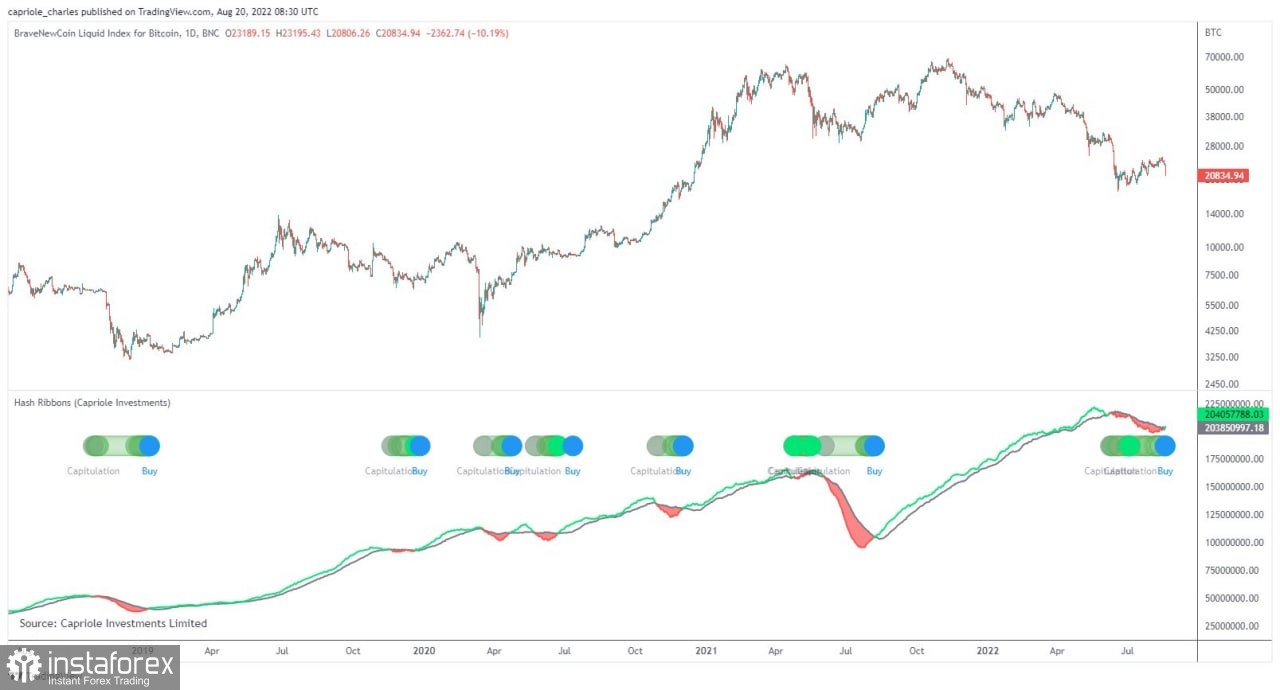
The second factor influencing the price reduction is the capitulation of the miners. Bitcoin mining companies, as of August 22, have sold most of the BTC coins they received in July. Since the beginning of August, at least 6,000 coins have been transferred to exchanges. At the same time, there is reason to believe that the capitulation of miners is gradually coming to an end. This opinion was shared by Charles Edwards, founder of the Capriole Investments firm. The entrepreneur believes that the current capitulation of mining companies has already become the third longest in history. Most likely, this is a sign of its completion in the coming months.
Despite the local negative situation and the likely retest of $20k, Bitcoin is gradually approaching the end of the main phase of the bear market. At the same time, it is too early to talk about the beginning of a recovery movement since the coin does not have fundamental factors for growth. With this in mind, in the short term, we are waiting for another fall in the price of BTC. In the medium term, we should expect the trend in the cryptocurrency price movement to continue within a wide range of fluctuations of $20k–$25k.


 Bitcoin
  Ethereum
  Tether
  USDC
USDC  Dogecoin
  Cardano
  Bitcoin Cash
  Polygon
  Litecoin
  LEO Token
  OKB
OKB  Stellar
  Cosmos Hub
  Hedera
  Maker
Maker  Algorand
  NEO
NEO  Synthetix Network
  Gate
Gate  KuCoin
  IOTA
IOTA  Tether Gold
  TrueUSD
  Enjin Coin
  0x Protocol
  Ravencoin
  Holo
Holo  Siacoin
  Basic Attention
  Decred
  Zcash
Zcash  Ontology
  Waves
Waves  Lisk
Lisk  DigiByte
  Numeraire
  Status
  Nano
Nano  Pax Dollar
  Steem
Steem  OMG Network
  BUSD
BUSD  Ren
Ren  Bitcoin Diamond
  Bytom
Bytom  HUSD
HUSD  Energi
  Augur
Augur