


Will XRP Manage to Break $0.40 or is Another Drop Incoming? (Ripple Price Analysis)

After seven weeks, XRP managed to push back above $0.4, but the bears were quick to push the price back below it. In order for the bullish structure to remain valid, the bulls must not allow the price to go below $0.33.
Technical Analysis
By Grizzly
The Daily Chart
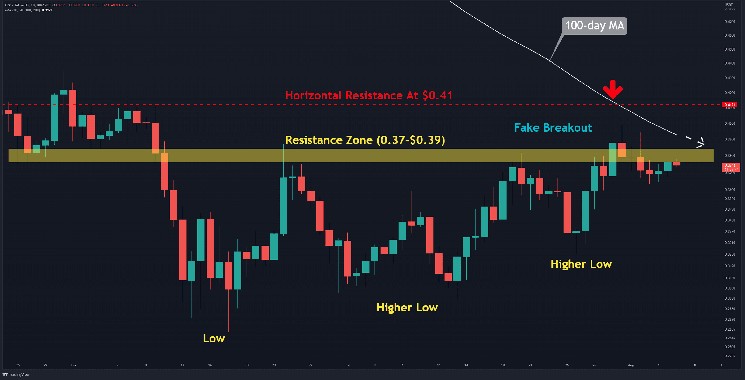
The bullish structure resulting from the formation of higher highs and higher lows is visible in the following chart. Late last week, the bulls succeeded in their third attempt to break the resistance zone in the $0.37-$0.39 range (in yellow). This extended the price towards the 100-day moving average (in white), although it was not reached or surpassed.
The bears defended this level, resulting in a fake breakout appearing on the chart. The pair is currently trading below the resistance zone, and the MA100 is approaching this level.
The bullish structure would be even stronger if the bulls can push XRP above $0.41. A break and close above this resistance would signal the start of a rally with a target of $0.5. By contrast, if buyers fail to impede the recent decline above $0.33, the bullish structure would be invalidated.
Key Support Levels: $0.33 & $0.30
Key Resistance Levels: $0.39 & $0.41
Daily Moving Averages
MA20: $0.36
MA50: $0.34
MA100: $0.40
MA200: $0.57
The XRP/BTC Chart
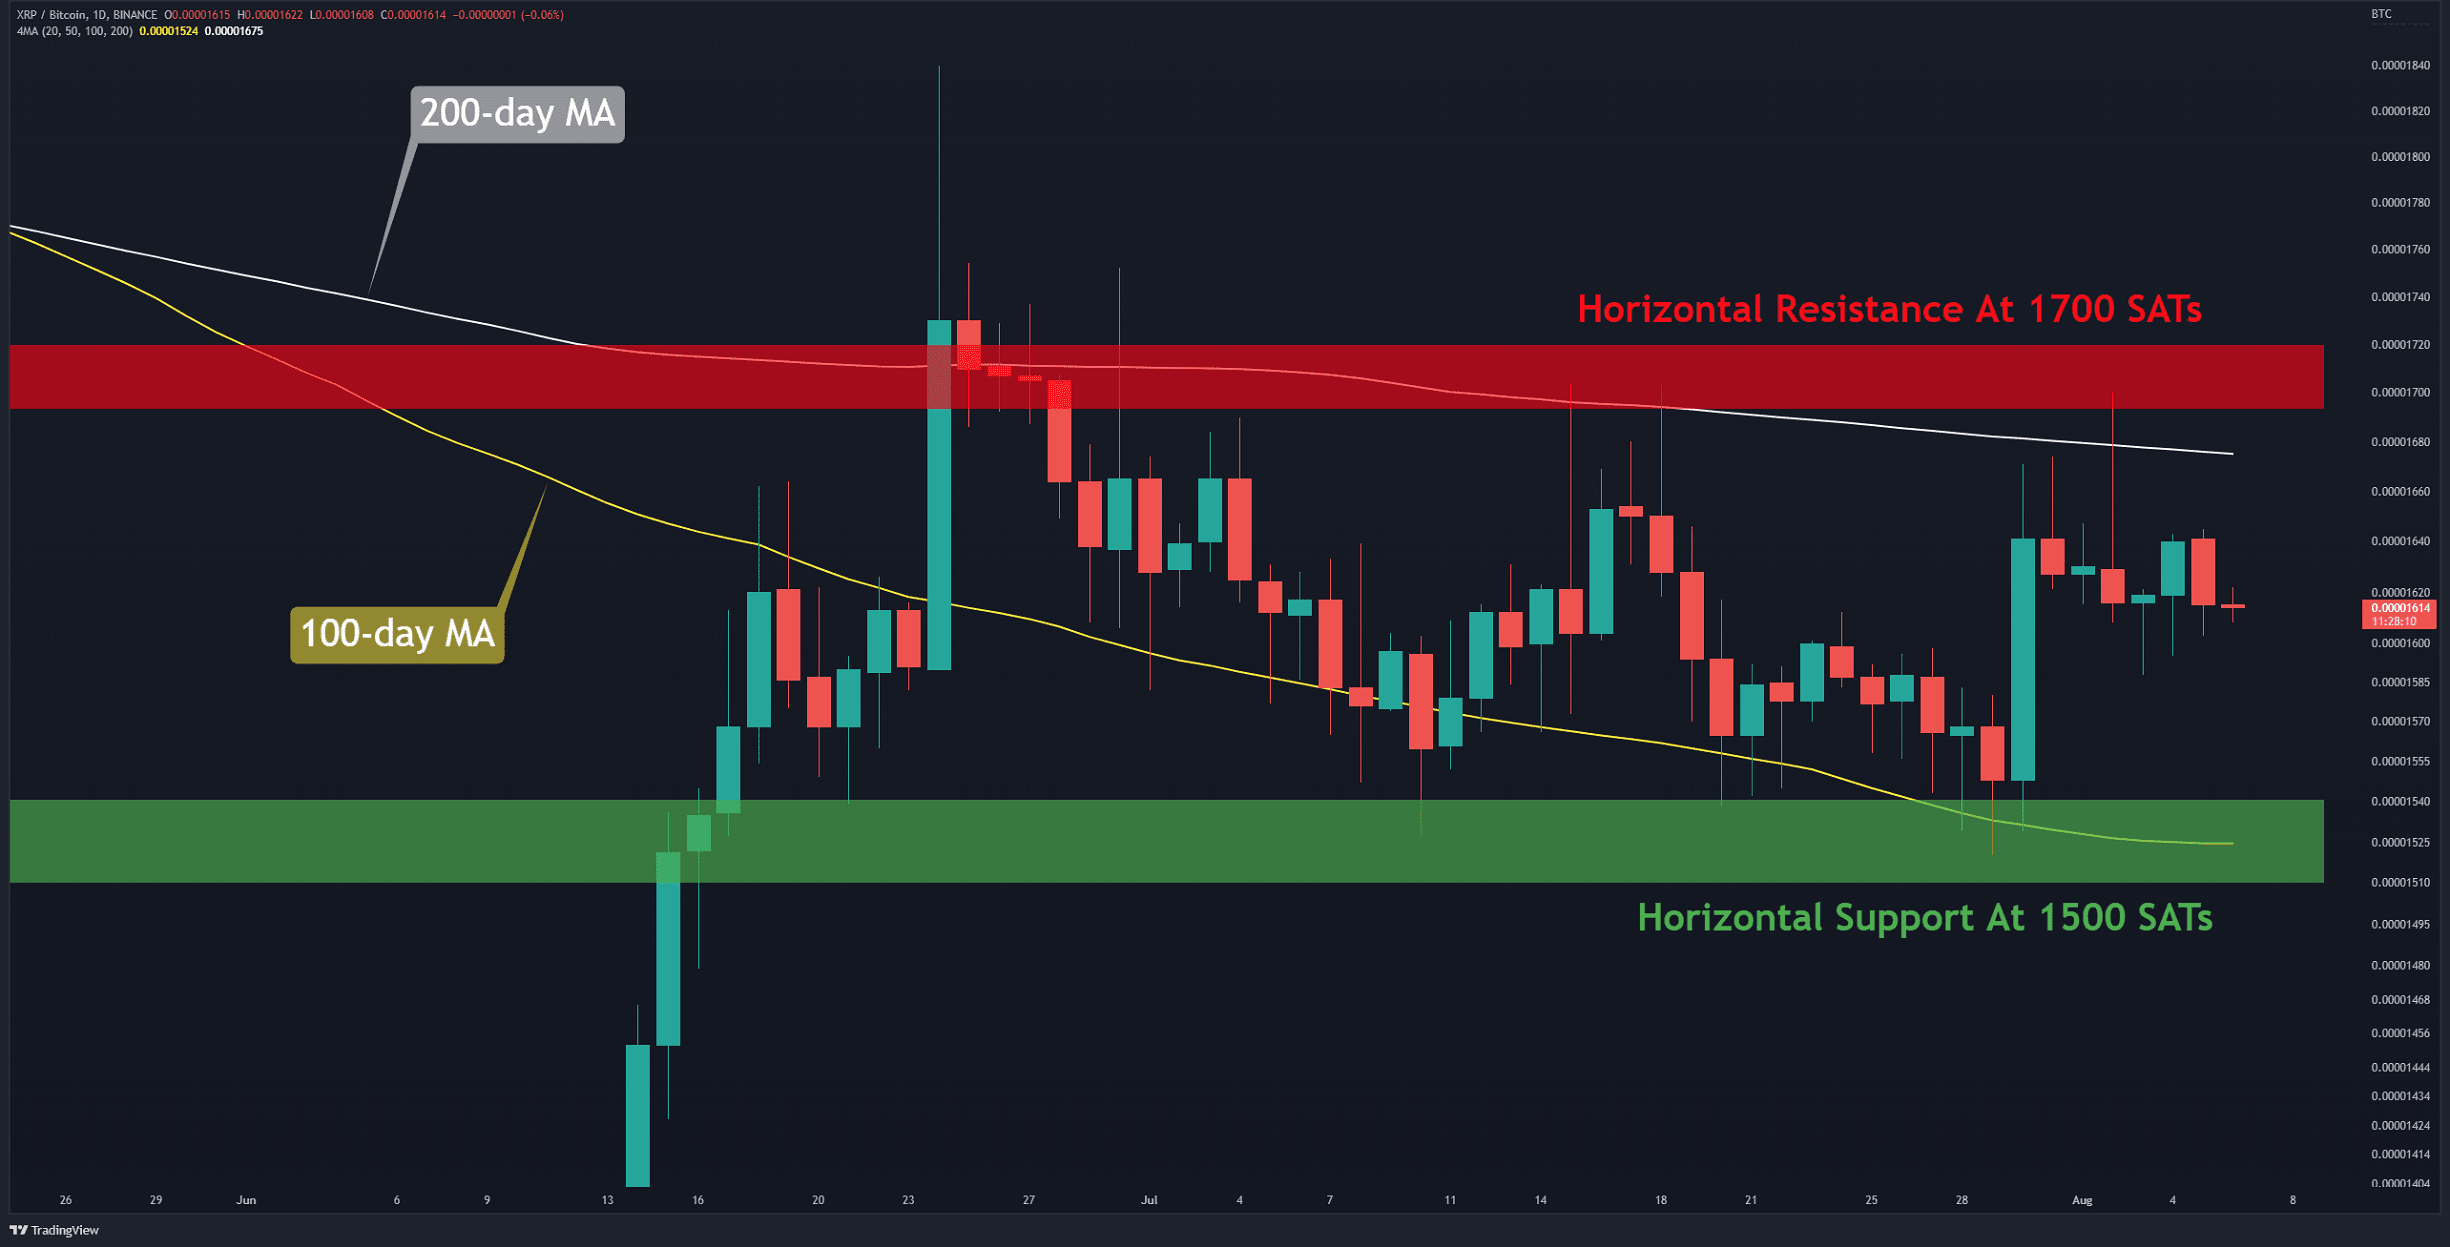
Against BTC, the cryptocurrency is fluctuating between the 100-day moving average from the down-side (in yellow) and the 200-day moving average from the up-side (in white). This has caused the price to range between two support and resistance zones ranging from 1500 SATs (in green) to 1700 SATs (in red). No significant movement can be expected until the price breaks out of this tight range-bound.
Key Support Levels: 1500 SATs & 1370 SATs
Key Resistance Levels: 1700 SATs & 2100 SATs


 Bitcoin
  Ethereum
  Tether
  USDC
USDC  Dogecoin
  Cardano
  Bitcoin Cash
  Polygon
  Litecoin
  LEO Token
  OKB
OKB  Cosmos Hub
  Stellar
  Hedera
  Maker
Maker  Algorand
  NEO
NEO  Synthetix Network
  Gate
Gate  KuCoin
  IOTA
IOTA  Tether Gold
  TrueUSD
  Enjin Coin
  0x Protocol
  Ravencoin
  Holo
Holo  Siacoin
  Basic Attention
  Zcash
Zcash  Decred
  Ontology
  Lisk
Lisk  Waves
Waves  DigiByte
  Numeraire
  Status
  Nano
Nano  Pax Dollar
  Steem
Steem  OMG Network
  BUSD
BUSD  Ren
Ren  Bitcoin Diamond
  Bytom
Bytom  HUSD
HUSD  Energi
  Augur
Augur