


XRP Must Hold This Critical Level To Prevent a Crash (Ripple Price Analysis)

In their second attempt to break above the overhead resistance at $0.38, the bulls once again failed. This caused the price to move towards the 50-day moving average line.
Technical Analysis
By Grizzly
The Daily Chart
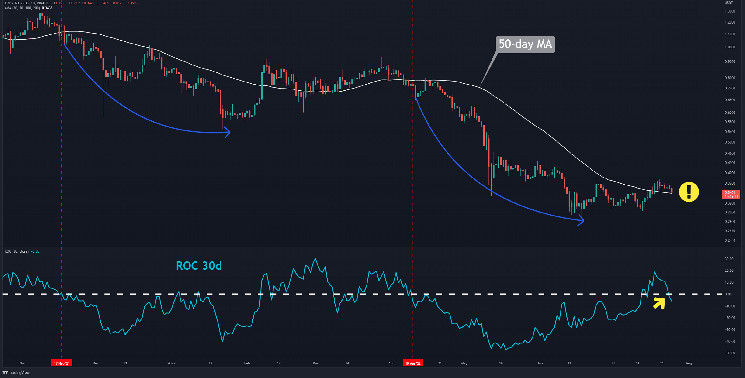
Although the weekly candle closed in the green yesterday, the long upper shadow shows that the selling pressure near the horizontal resistance at $0.38 is relatively high. The bears pushed the price down by 10% as of this writing. The price has now touched the 50-day simple moving average line (in white). On the other hand, the Rate of Change (ROC) 30d indicator broke below the baseline (in yellow) and entered the negative territory.
Taking into account the last two downward trends (in blue), it is evident that deep declines are triggered when the price penetrates below the MA50, and at the same time, the ROC gains momentum below the baseline. Therefore, it is crucial that the price does not revisit below $0.33. If the bears dominate the market again, the support at $0.3 is expected to be retested.
Key Support Levels: $0.38 & $0.42
Key Resistance Levels: $0.33 & $0.3
Daily Moving Averages:
MA20: $0.34
MA50: $0.34
MA100: $0.43
MA200: $0.59
The XRP/BTC Chart
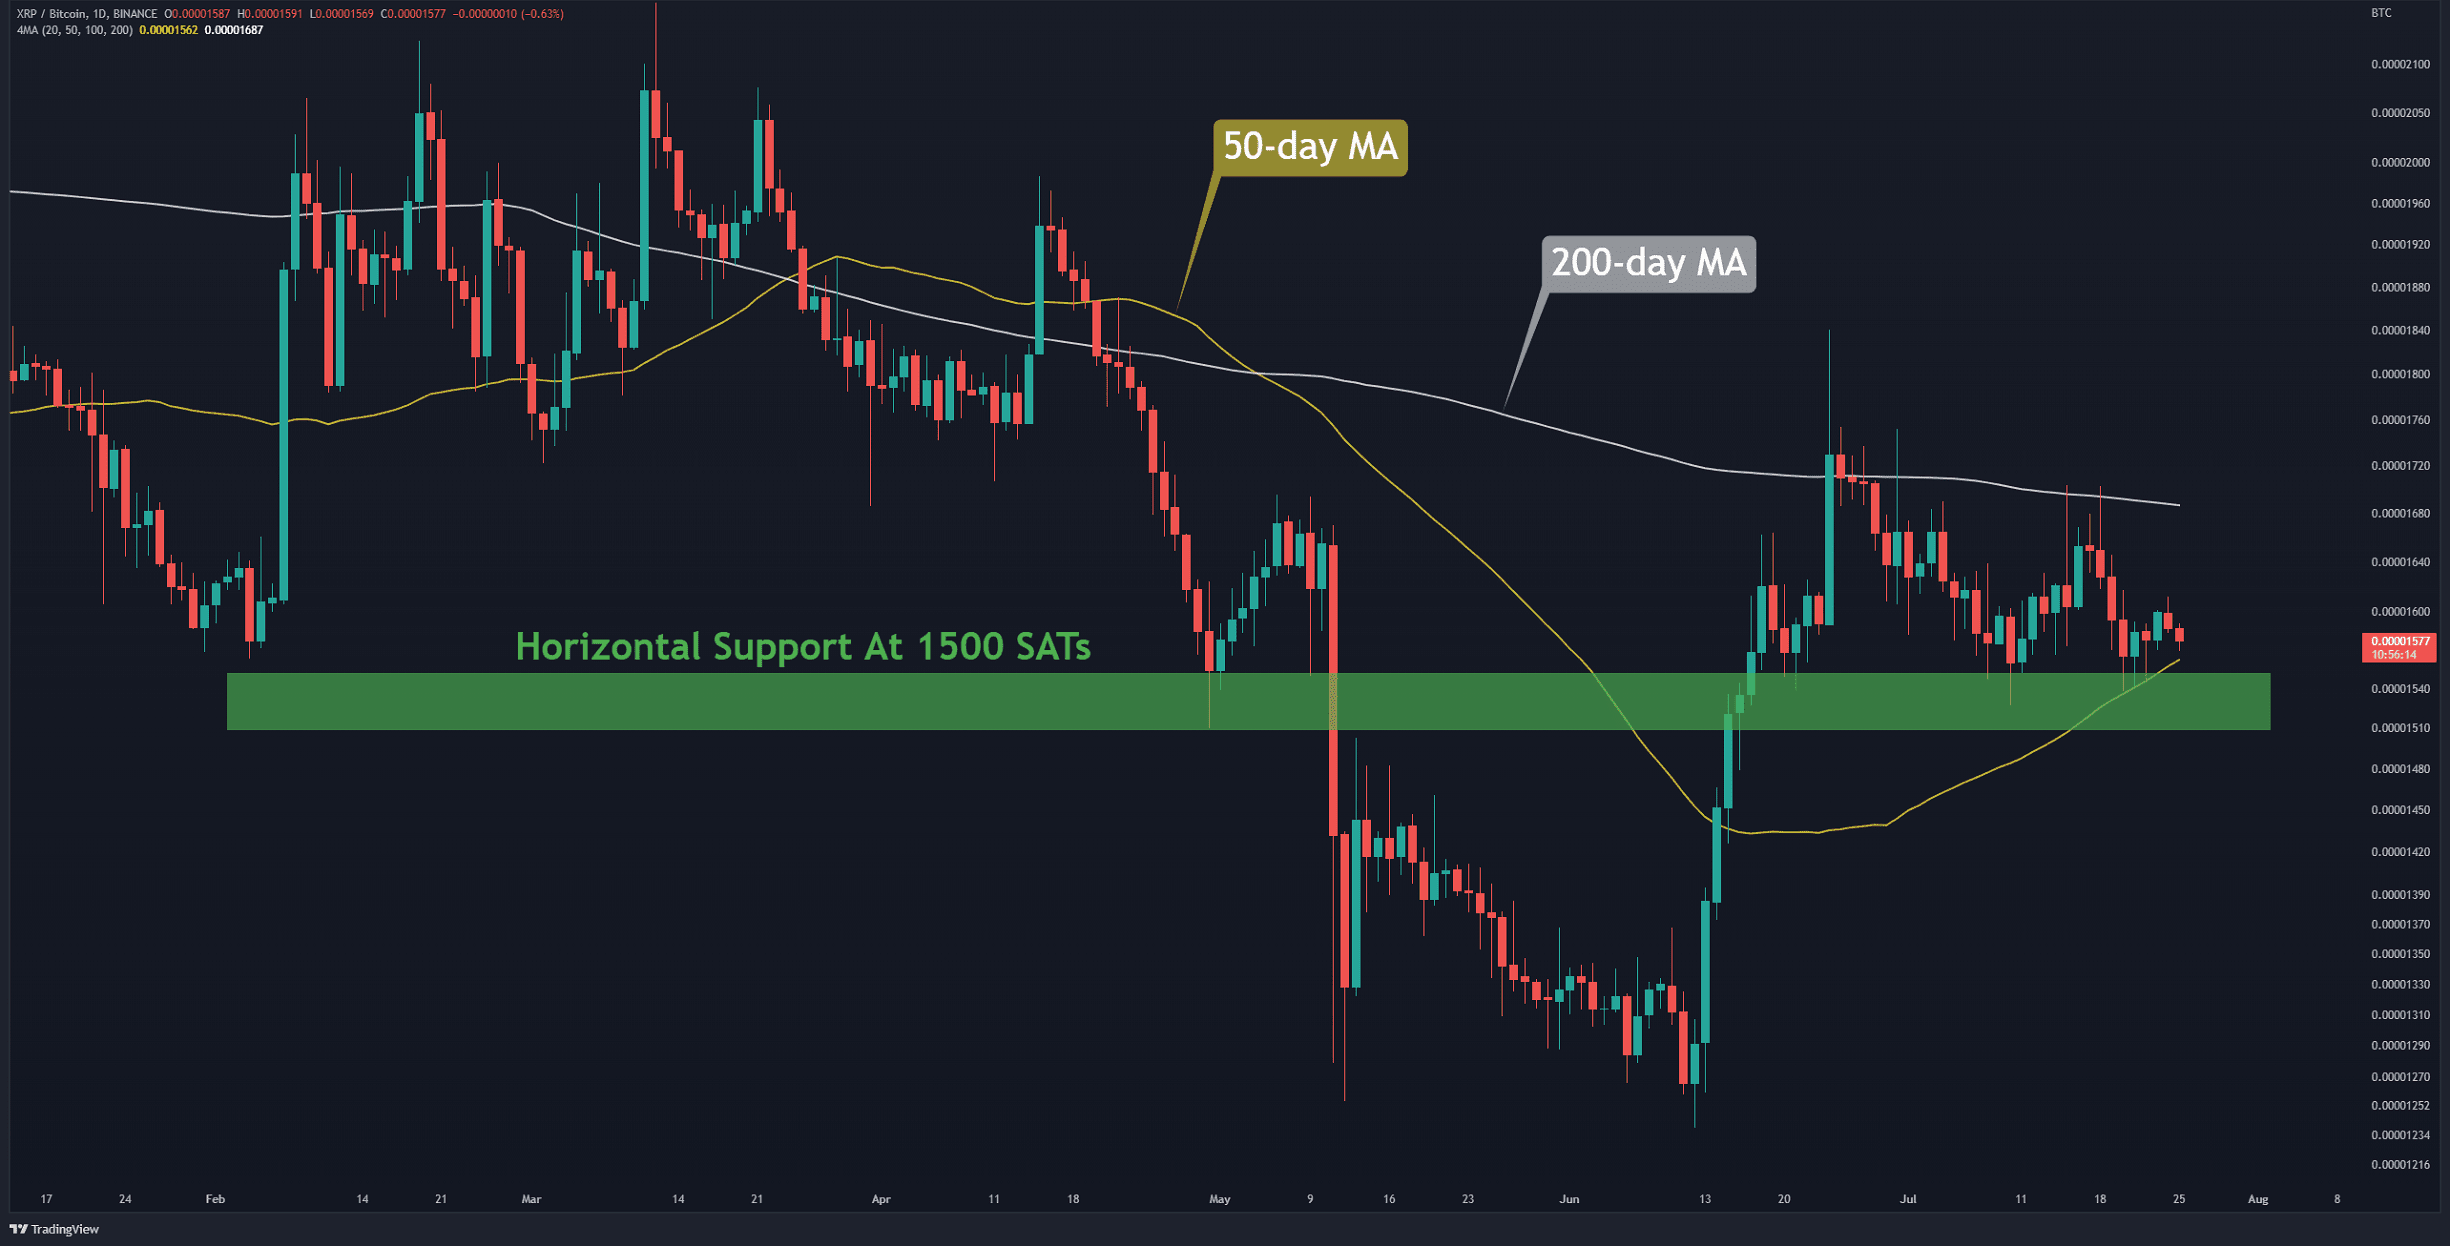
Against Bitcoin, the price is stuck between the 200-day moving average (in white) and the 50-day MA (in yellow). Meanwhile, the bulls have defended the horizontal support at 1500 SATs (in green) so far. Determination of direction in the coming days depends on claiming one of these two moving averages. No significant movement is expected if the price remains in the 1500-1800 SATs range.
Key Support Levels: 1500 SATs & 1370 SATs
Key Resistance Levels: 1800 SATs & 2100 SATs


 Bitcoin
  Ethereum
  Tether
  USDC
USDC  Dogecoin
  Cardano
  Bitcoin Cash
  Polygon
  Litecoin
  LEO Token
  Hedera
  Stellar
  Cosmos Hub
  OKB
OKB  Maker
Maker  Algorand
  NEO
NEO  Gate
Gate  Synthetix Network
  KuCoin
  IOTA
IOTA  Tether Gold
  TrueUSD
  Enjin Coin
  Ravencoin
  Holo
Holo  0x Protocol
  Siacoin
  Basic Attention
  Decred
  Ontology
  Zcash
Zcash  Lisk
Lisk  Waves
Waves  DigiByte
  Numeraire
  Status
  Nano
Nano  Steem
Steem  Pax Dollar
  OMG Network
  BUSD
BUSD  Ren
Ren  Bytom
Bytom  Bitcoin Diamond
  HUSD
HUSD  Energi
  Augur
Augur