


XRP Price Plummets 25% – Will Stellar (XLM) Follow Suit?

Both XRP (XRP) and Stellar (XLM) have been falling since Sept. 23. While the bullish structure for the former is still intact, the latter is more decisively bearish, suggesting new lows will eventually occur.
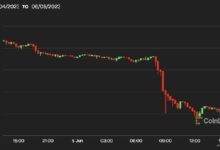
On Sept. 17, XRP broke out from a descending triangle pattern which had been in place since June 14. The breakout led to a high of $0.559 six days later, an increase of 64%. It is possible that the increase was fueled by speculation about a positive settlement in the ongoing Ripple vs SEC case.
However, the price has been falling since, leading to a low of $0.416 on Wednesday, a decrease of 25% measuring from the high. The decrease occurred despite partnership announcements with both I-Remit and Armada Music.
Throughout this downward movement, the daily RSI has also fallen below 70 (red icon), a sign of a bearish trend.
If the downward movement continues, the closest support area would be at $0.384. The area had previously acted as resistance since June and is now expected to provide support.
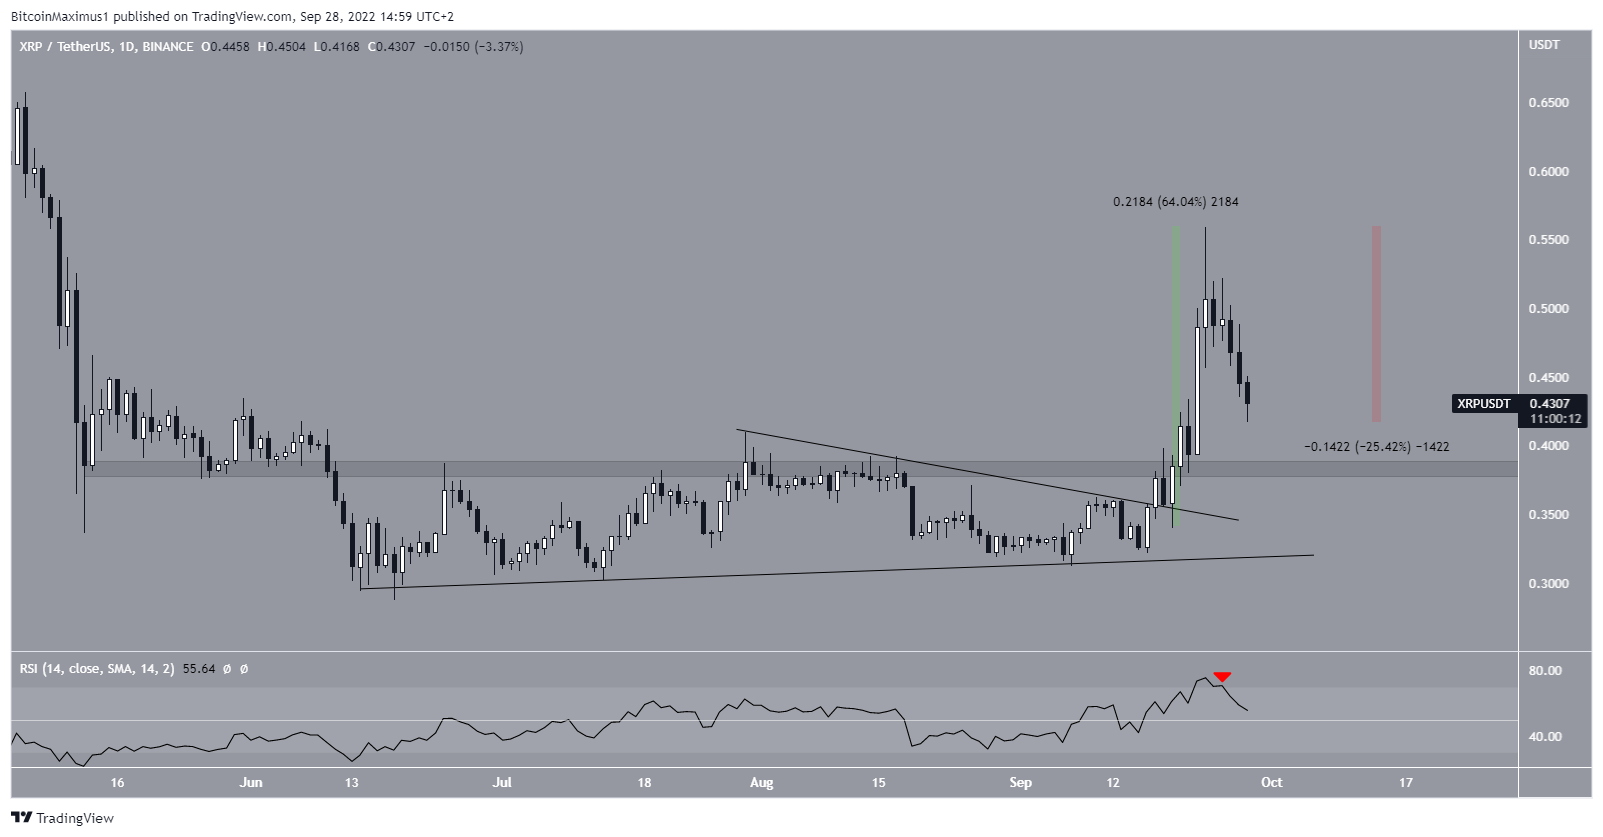
XRP/USDT Chart By TradingView
Future still looking bullish for XRP
Despite this ongoing fall in the daily time frame, the outlook from the weekly chart is still bullish. The main reason for this is that the price has broken out a long-term descending resistance line (dashed) and now seems to be validating it as support.
So, a re-test of the $0.384 support area would also cause a validation of the line as support.
However, in order for the bullish reversal to be confirmed, the weekly RSI has to move above 50 and break out from its own descending resistance line (black). Until that occurs, the bullish reversal cannot be confirmed despite it being likely.
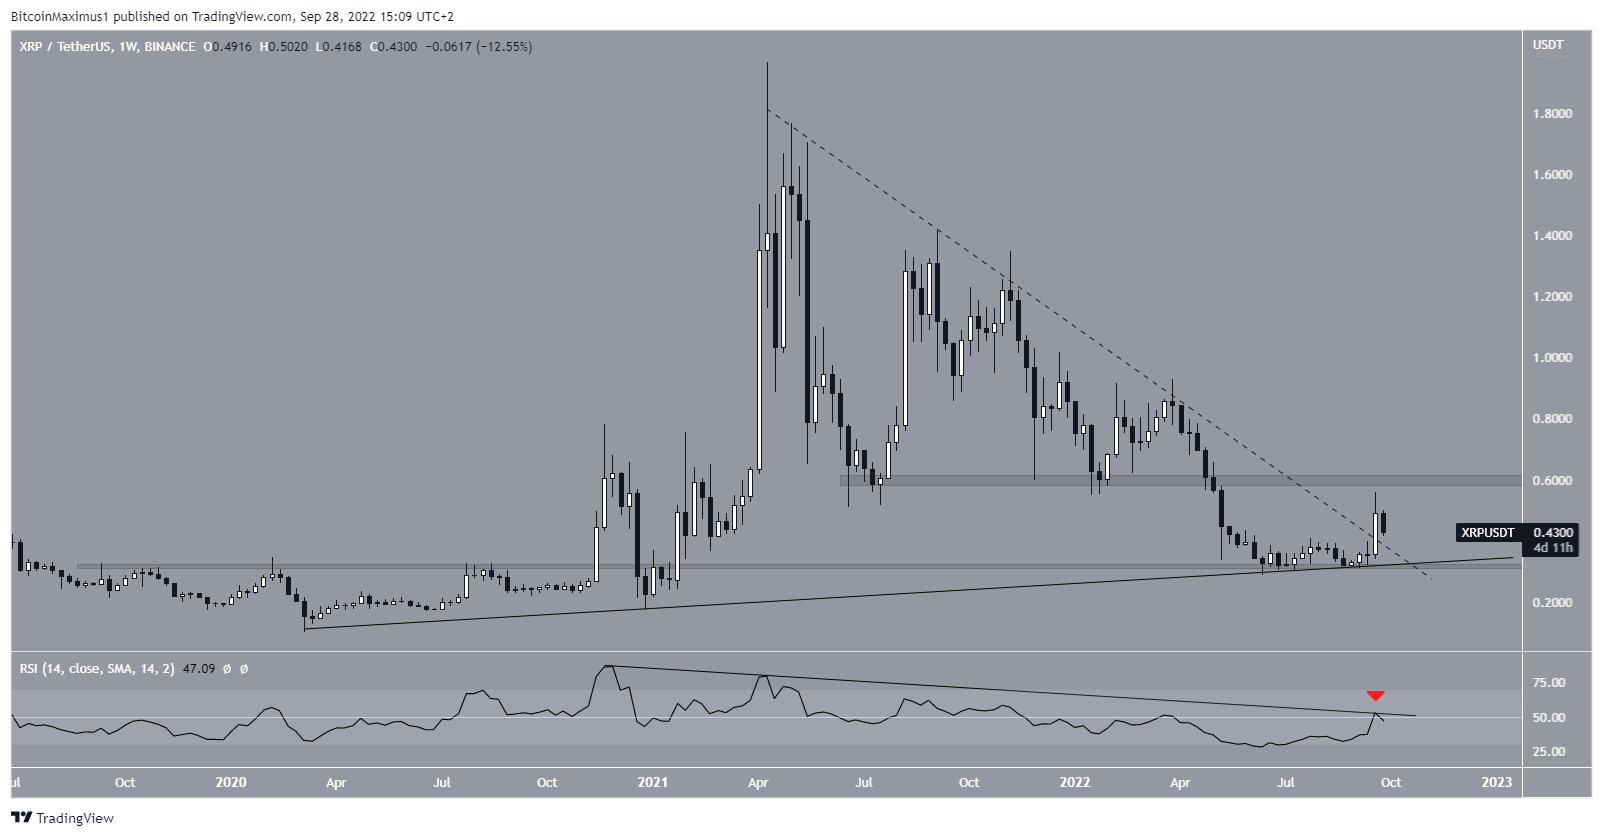
XRP/USDT Chart By TradingView
XLM future less positive
The price movement for XLM is more bearish than that of XRP. The price has been decreasing underneath a descending resistance line since the beginning of June. More recently, the line caused a rejection on Sept. 23 (red icon).
The ensuing decrease also caused the RSI to fall below 50, in what is considered a sign of a bearish trend. As a result, the outlook from the daily time frame is decisively bearish.
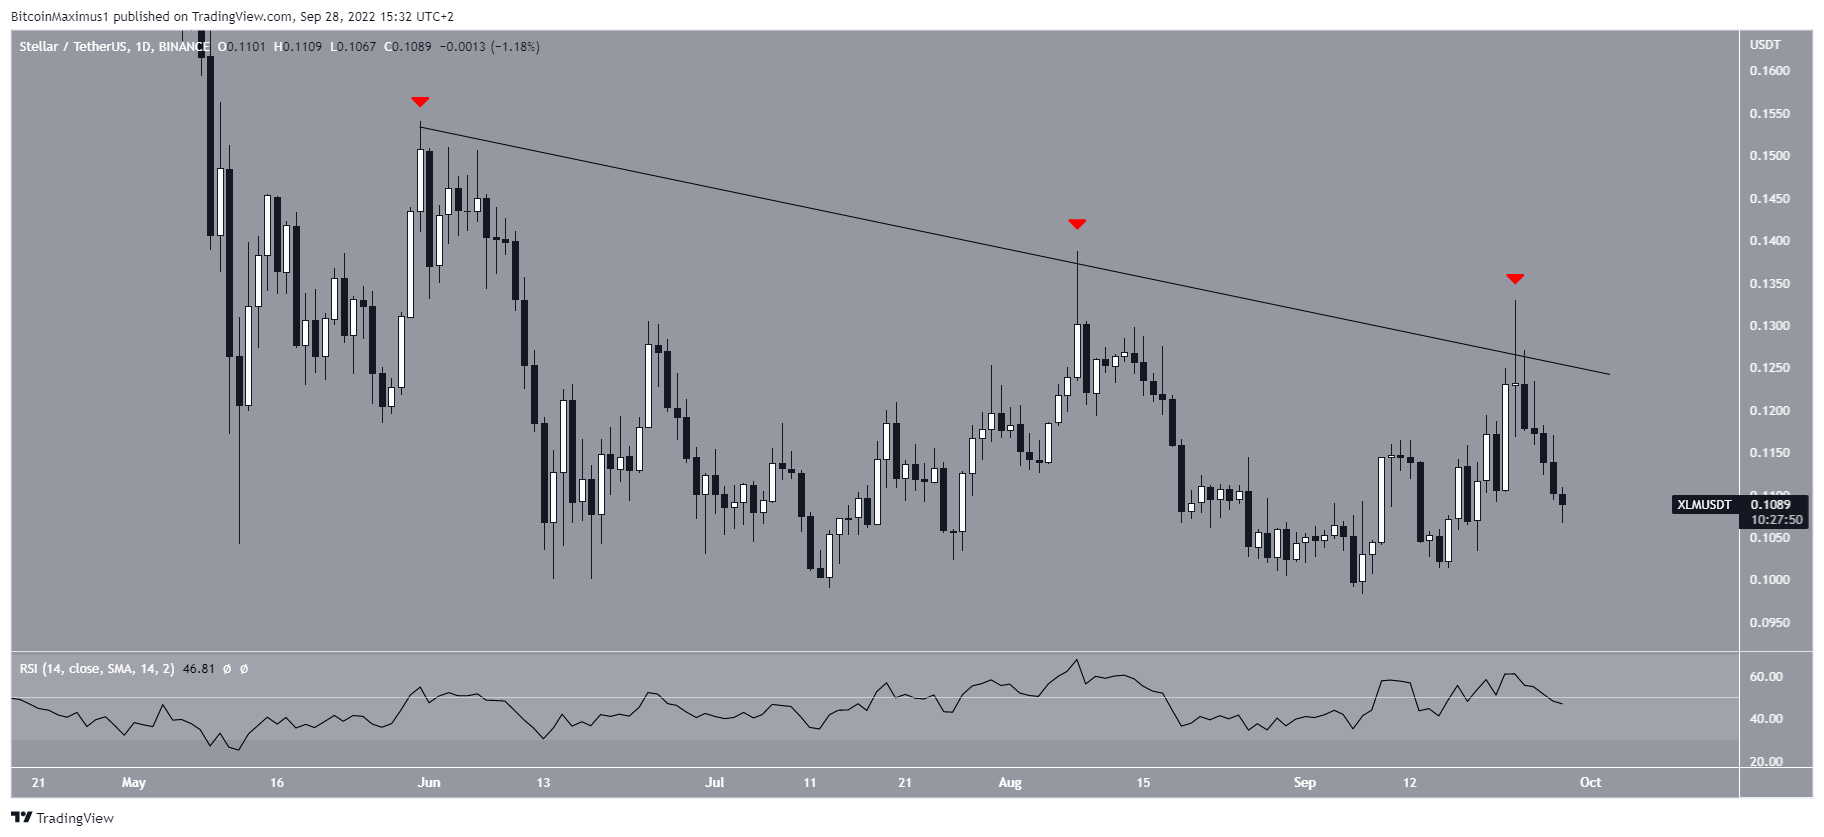
XLM/USDT Chart By TradingView
Furthermore, it seems that the price has completed an A-B-C corrective structure, in which waves A:C have had a 1:1.61 ratio. This is a common ratio in such structures.
Since the correction is moving upward, this means that the trend is still bearish. A decrease below the $0.098 lows (red line) would be expected to accelerate the rate of decrease due to the lack of support below it.
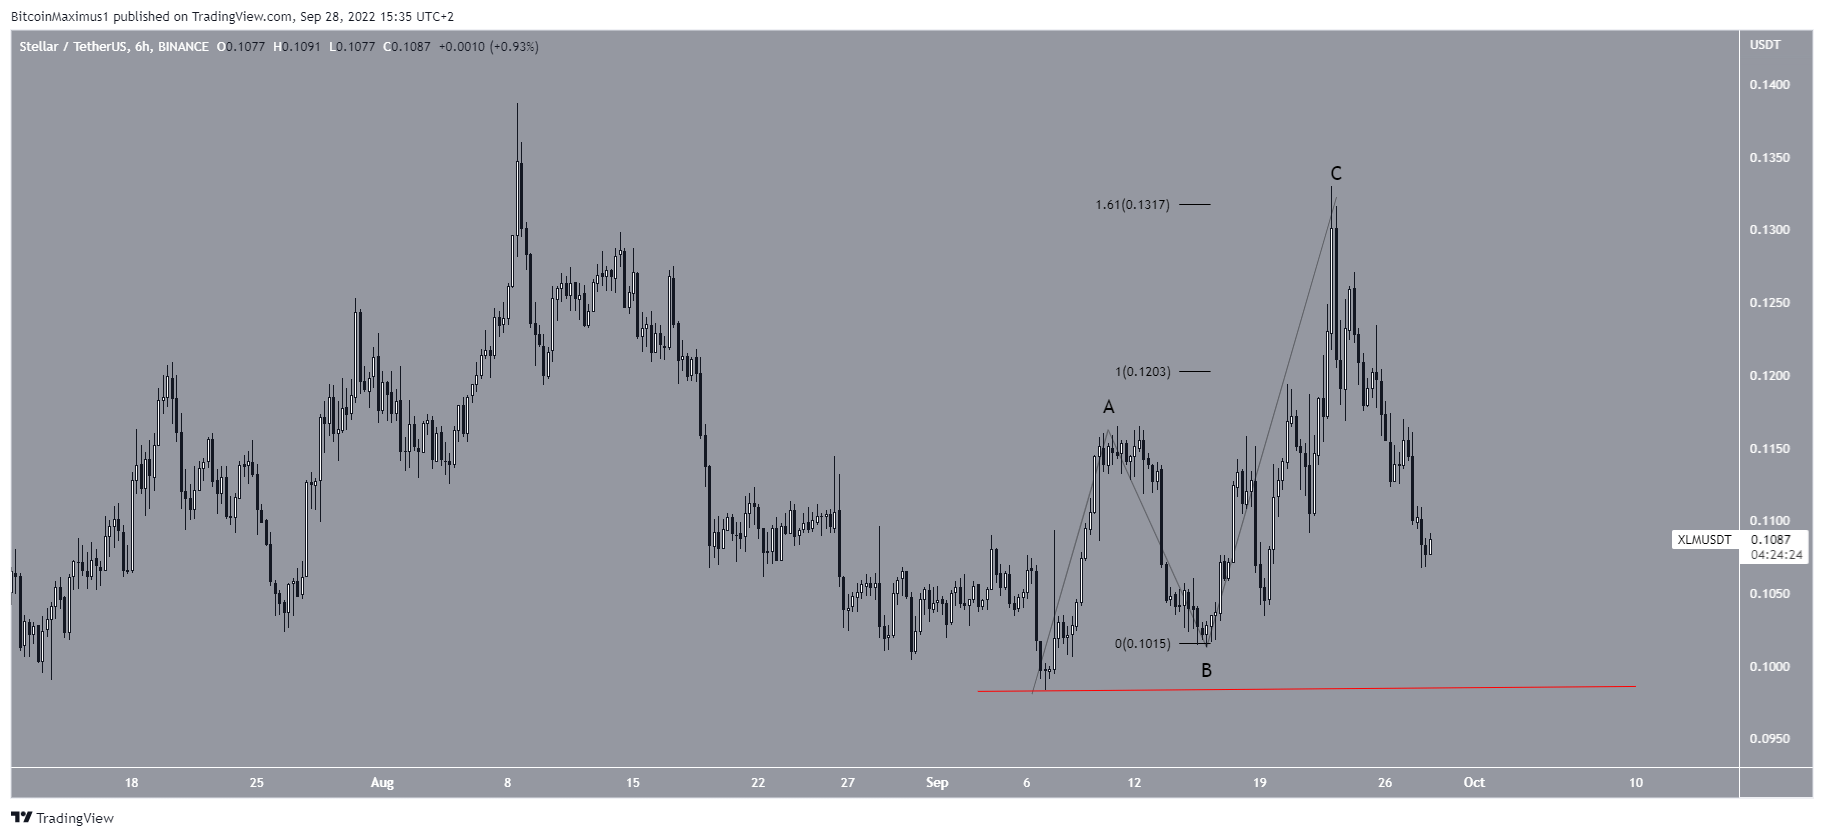
XLM/USDT Chart By TradingView


 Bitcoin
  Ethereum
  Tether
  USDC
USDC  Dogecoin
  Cardano
  Bitcoin Cash
  Polygon
  Litecoin
  LEO Token
  Hedera
  Cosmos Hub
  Stellar
  OKB
OKB  Maker
Maker  Algorand
  NEO
NEO  Gate
Gate  Synthetix Network
  KuCoin
  IOTA
IOTA  Tether Gold
  Enjin Coin
  TrueUSD
  Holo
Holo  Ravencoin
  0x Protocol
  Siacoin
  Basic Attention
  Decred
  Ontology
  Zcash
Zcash  Waves
Waves  Lisk
Lisk  DigiByte
  Status
  Numeraire
  Nano
Nano  Steem
Steem  Pax Dollar
  OMG Network
  BUSD
BUSD  Ren
Ren  Bytom
Bytom  Bitcoin Diamond
  HUSD
HUSD  Energi
  Augur
Augur