


XRP Stalls at $0.37, But Is Another Crash Incoming? (Ripple Price Analysis)
Ripple has been experiencing a sideways trend below the stiff resistance for nearly three weeks and has remained range-bound between 0.36$ and $0.39 for the largest part.
Technical Analysis
By Grizzly
The Weekly Chart:
It appears that neither side is able to take assert convincing dominance in the market for XRP. The bulls need to flip the horizontal resistance at $0.39 (in red) to start a rally. The intersection of this resistance with the descending line (in yellow) has created a relatively strong barrier.
Breaking this resistance could result in XRP charging at the subsequent target, which currently lies at $0.46. This would improve the overall structure and put bulls back on track. However, if the bears get the upper hand, the cryptocurrency could revisit the support at $0.33 (in green).
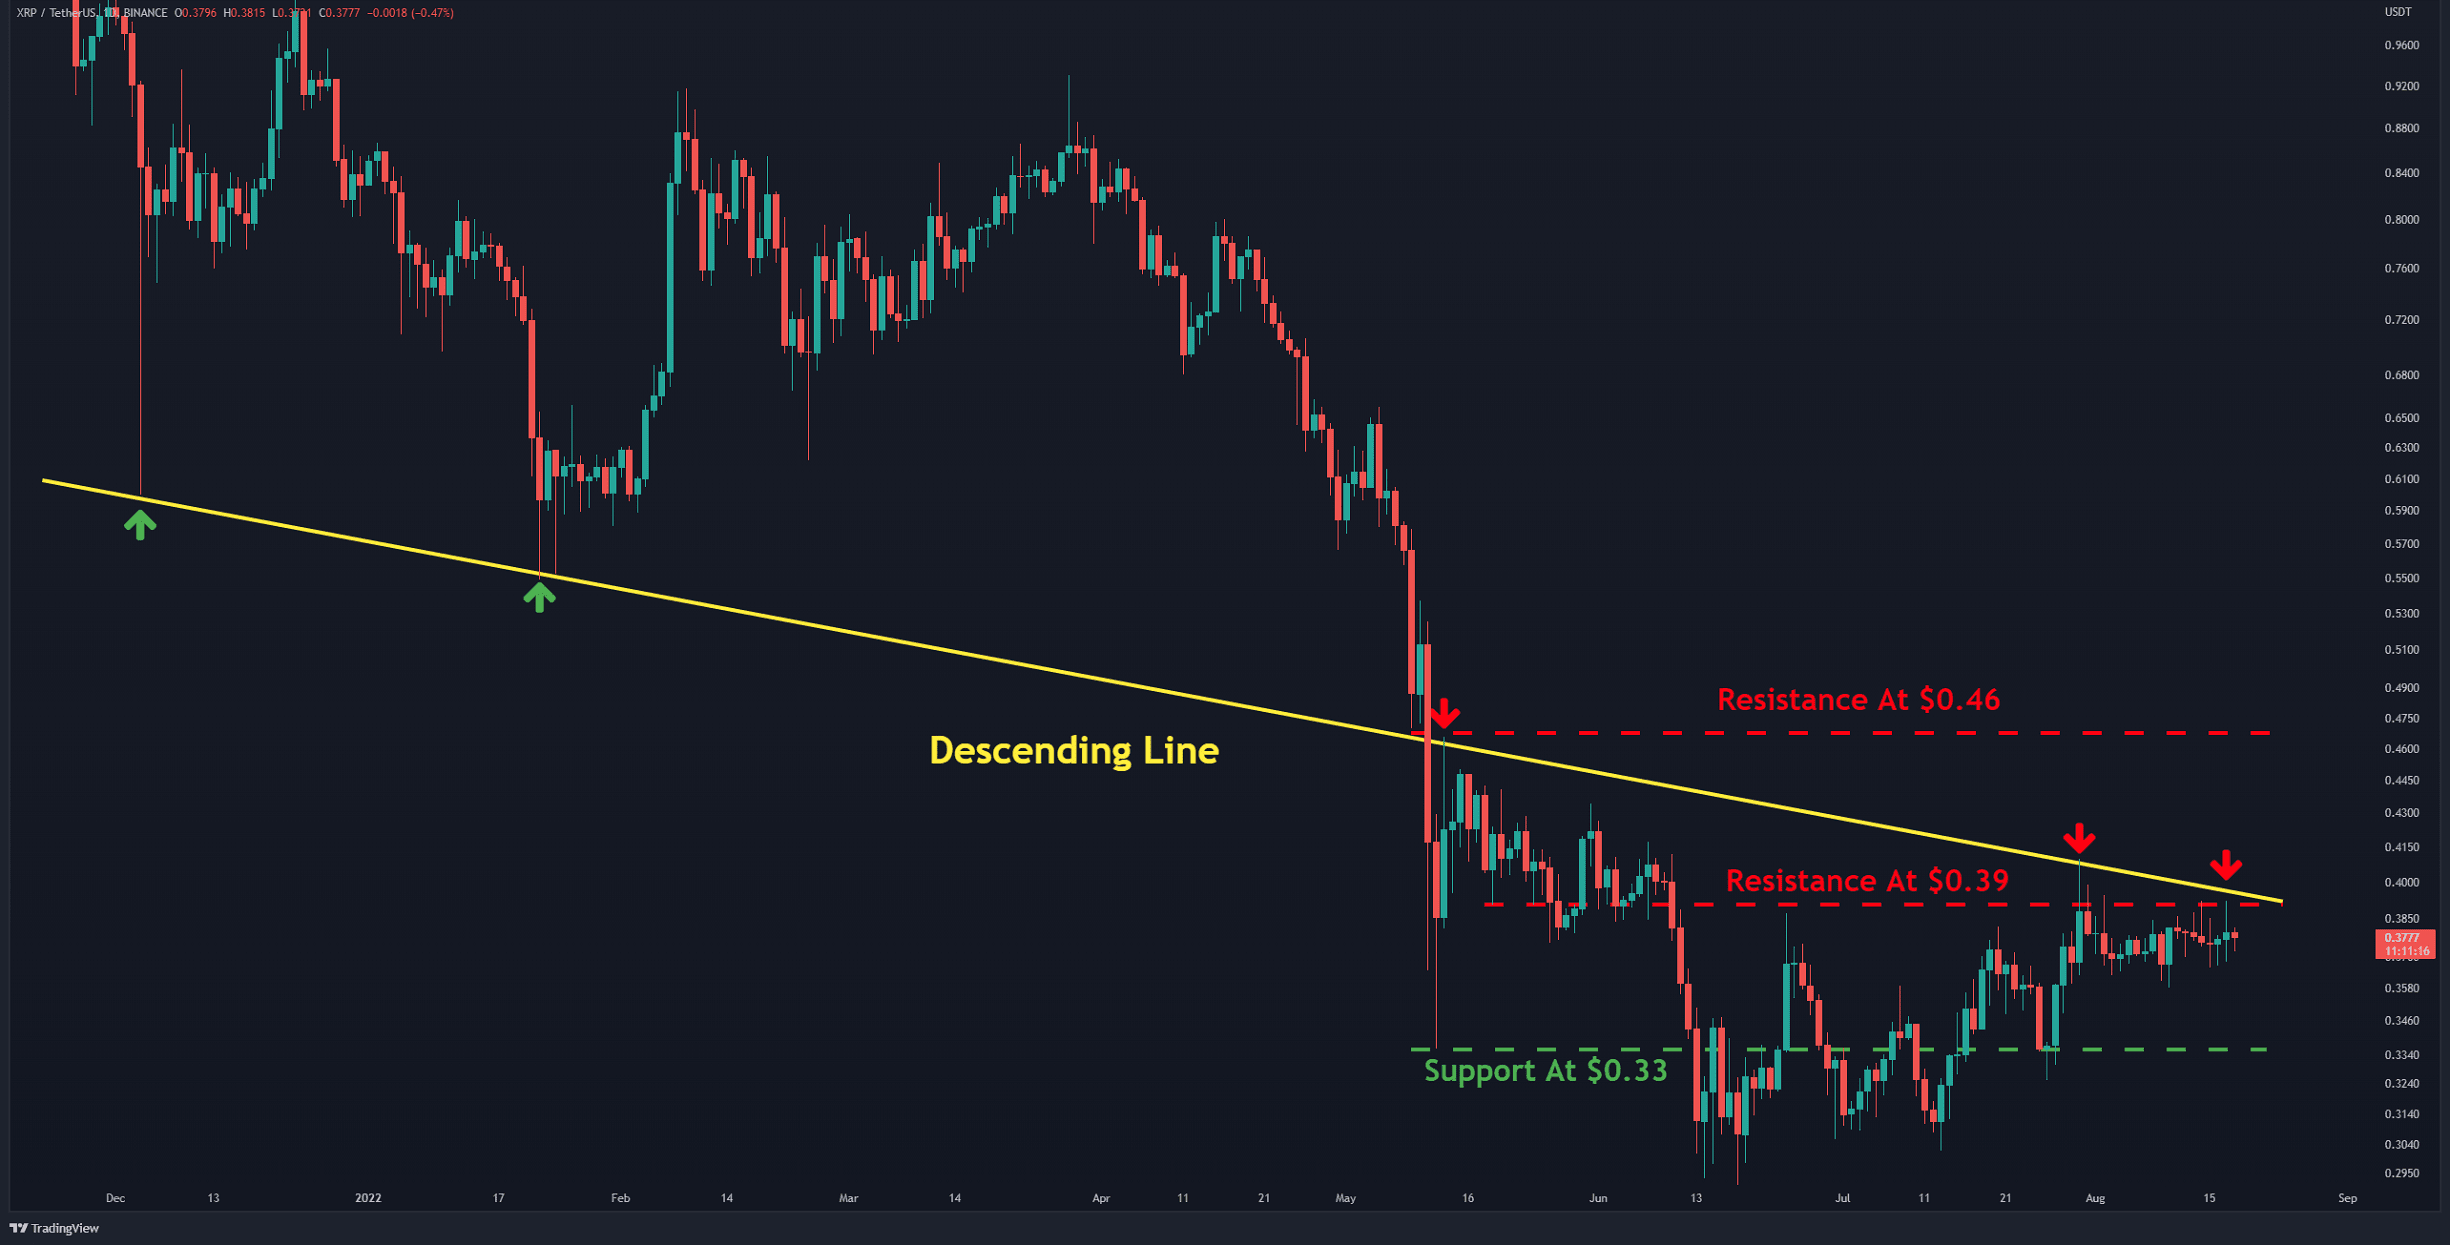
Key Support Levels: $0.33 & $0.28
Key Resistance Levels: $0.39 & $0.46
Daily Moving Averages:
MA20: $0.44
MA50: $0.71
MA100: $0.69
MA200: $0.48
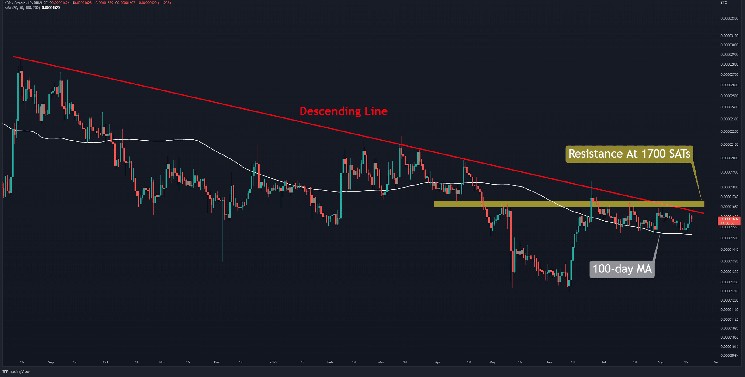
The XRP/BTC Chart:
Against Bitcoin, the price is struggling with descending line resistance (in red) and horizontal resistance at 1700 SATs (in yellow). From the bottom side, the 100-day moving average (in white) acts as a support line. The structure is bearish in the short term as we can see both lower highs and lower lows taking place. A close below 1500 SATs will trigger a corrective wave. On the other hand, if the bulls push XRP above 1,700 SATs, it will probably extend to the next target at 2,000 SATs.
Key Support Levels: 1500 SATs & 1370 SATs
Key Resistance Levels: 1700 SATs & 2100 SATs


 Bitcoin
  Ethereum
  Tether
  USDC
USDC  Dogecoin
  Cardano
  Bitcoin Cash
  Polygon
  Litecoin
  LEO Token
  Hedera
  Stellar
  Cosmos Hub
  OKB
OKB  Maker
Maker  Algorand
  NEO
NEO  Gate
Gate  KuCoin
  Synthetix Network
  IOTA
IOTA  Tether Gold
  TrueUSD
  Enjin Coin
  Holo
Holo  Ravencoin
  0x Protocol
  Siacoin
  Basic Attention
  Ontology
  Decred
  Zcash
Zcash  Waves
Waves  Lisk
Lisk  DigiByte
  Numeraire
  Status
  Nano
Nano  Pax Dollar
  Steem
Steem  OMG Network
  BUSD
BUSD  Ren
Ren  Bytom
Bytom  Bitcoin Diamond
  HUSD
HUSD  Energi
  Augur
Augur