


XRP Technical Analysis: Retracement From $0.36 Warns Bearish Trend

The Ripple(XRP) price action shows an increase in selling pressure above $036, resulting in a retracement to retest the broken trendline. Key technical points:
- The XRP prices dropped by 5.59% in the last 24 hours.
- The price action showcases a bearish reversal from $0.36 challenging the 50-day SMA.
- The 24-hour trading volume of Ripple is $1.34 Billion, indicating a drop of 17%.
Past Performance of XRP
XRP price action displays a bullish reversal from $0.30, breaking the long-coming resistance trendline on 16th July with a 5% jump. The bull run accounts for a price jump of 20% to reach the $0.36 mark. However, the supply dump above the resistance level influences a retracement of 6.5% over the past two weeks, influencing a retest of the broken trendline.
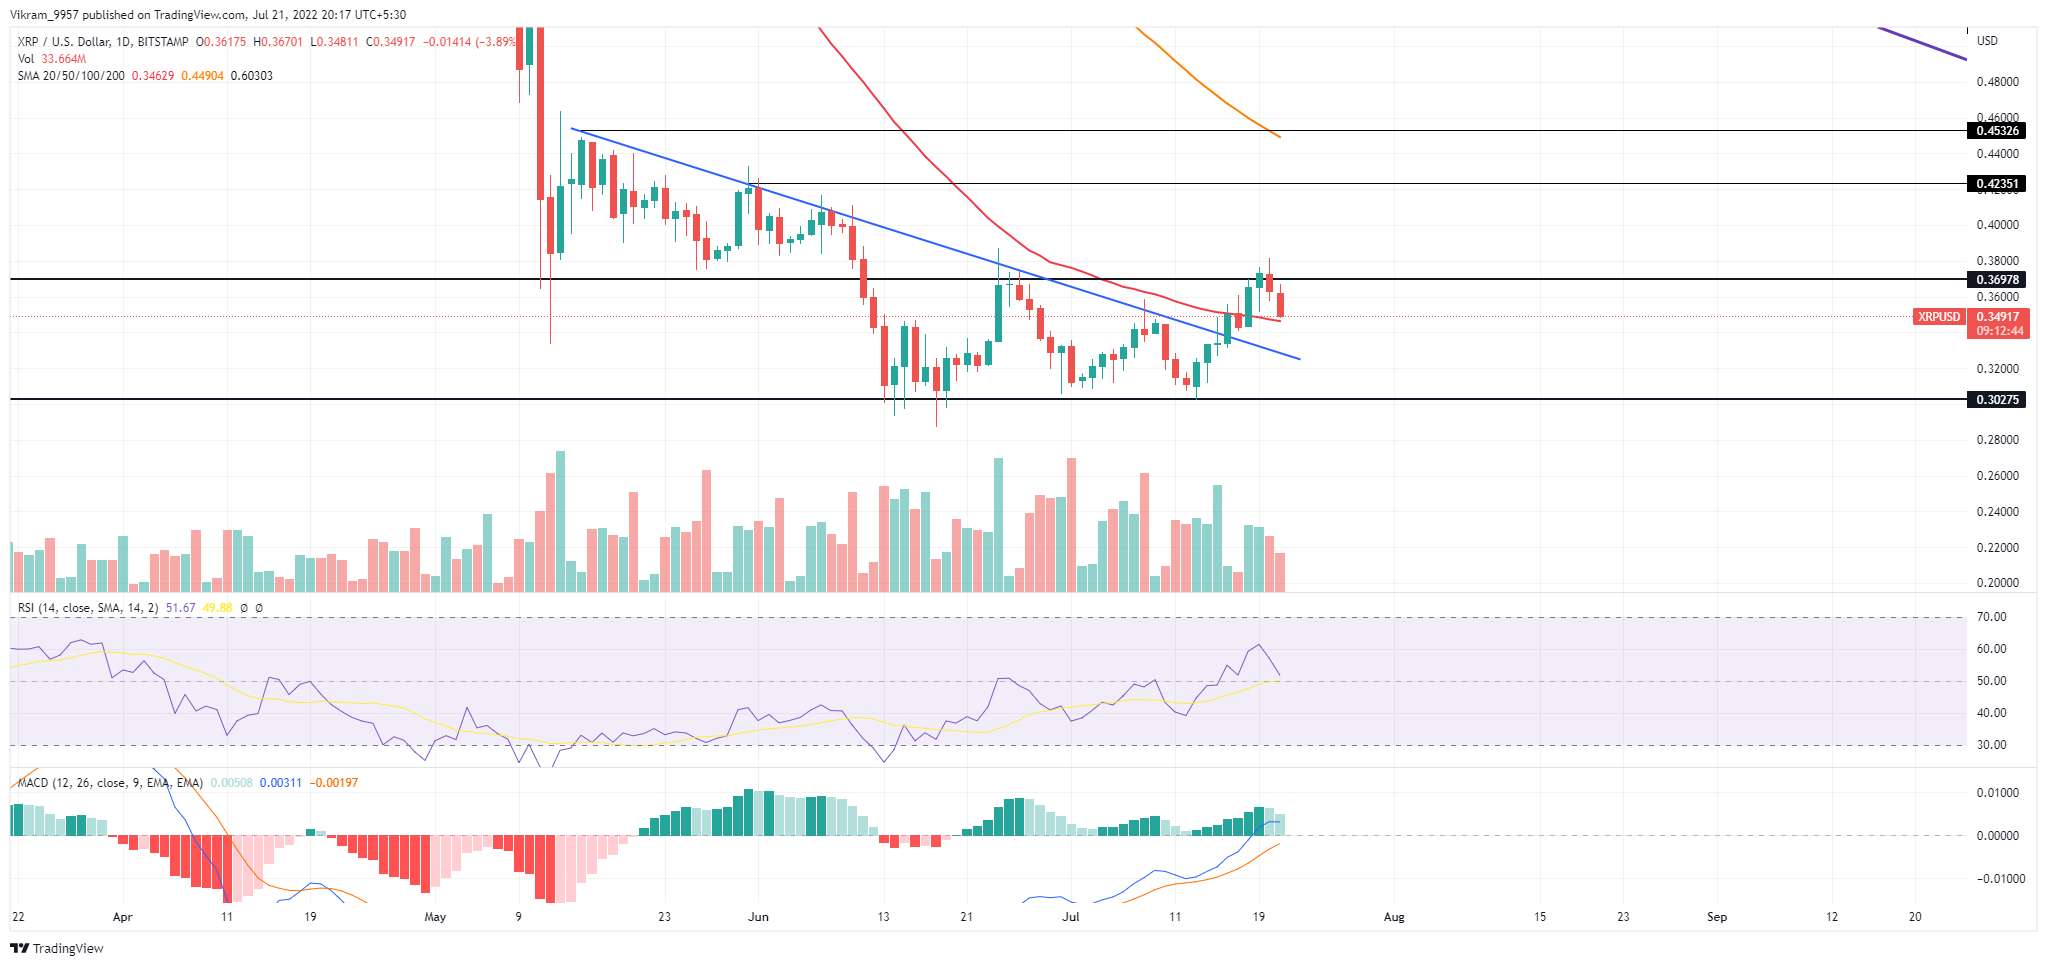
Source- Tradingview
XRP Technical Analysis
The XRP price chart shows the falling trend in trading volume during the downfall, which increases the likelihood of a bullish turnaround after a successful retest. Moreover, the 50-day SMA acts as the last stand to keep the market value floating above the $0.35 mark. The RSI indicator shows a weakness in the underlying bullishness as the RSI slope stepbacks to retest the halfway line. Hence, the technical indicator warns of a downtrend below the $0.35 mark. Furthermore, the MACD indicator displays a sudden rise in selling pressure as the positive histograms take a downturn. Therefore, the bullish spread takes a hit between the fast and slow lines teasing a potential bearish crossover. In a nutshell, the XRP technical analysis displays a high likelihood of a price drop under the $0.35 mark to retest the broken trendline.
Upcoming Trend
Considering the Ripple(XRP) prices drop below the 50-day SMA, traders can expect the fallout rally to reach the $0.32 mark. Resistance Levels: $0.36 and $0.40 Support Levels: $0.35 and $0.32


 Bitcoin
  Ethereum
  Tether
  USDC
USDC  Dogecoin
  Cardano
  Bitcoin Cash
  Polygon
  Litecoin
  LEO Token
  OKB
OKB  Stellar
  Cosmos Hub
  Hedera
  Maker
Maker  Algorand
  NEO
NEO  Synthetix Network
  Gate
Gate  KuCoin
  IOTA
IOTA  Tether Gold
  TrueUSD
  Enjin Coin
  0x Protocol
  Ravencoin
  Holo
Holo  Siacoin
  Basic Attention
  Decred
  Zcash
Zcash  Ontology
  Lisk
Lisk  Waves
Waves  DigiByte
  Numeraire
  Status
  Nano
Nano  Pax Dollar
  Steem
Steem  OMG Network
  BUSD
BUSD  Ren
Ren  Bitcoin Diamond
  Bytom
Bytom  HUSD
HUSD  Energi
  Augur
Augur