

Cryptocurrency market starts 2023 by reclaiming $800 billion market cap
The cryptocurrency market ended 2022 in a consolidation phase, with investors standing on the fence as major cryptocurrencies were unable to make decisive moves. However, the market is experiencing short-term buying pressure that has resulted in reclaiming key positions.
Indeed, as of January 2, 2023, the global crypto market capitalization reclaimed the $800 billion level to stand at $807.17 billion, although the value represents a drop of about $4.27 billion from the December 26 figure of $811.16 billion. On the weekly chart, the market cap hit its lowest point on December 30 at $788.93 billion.
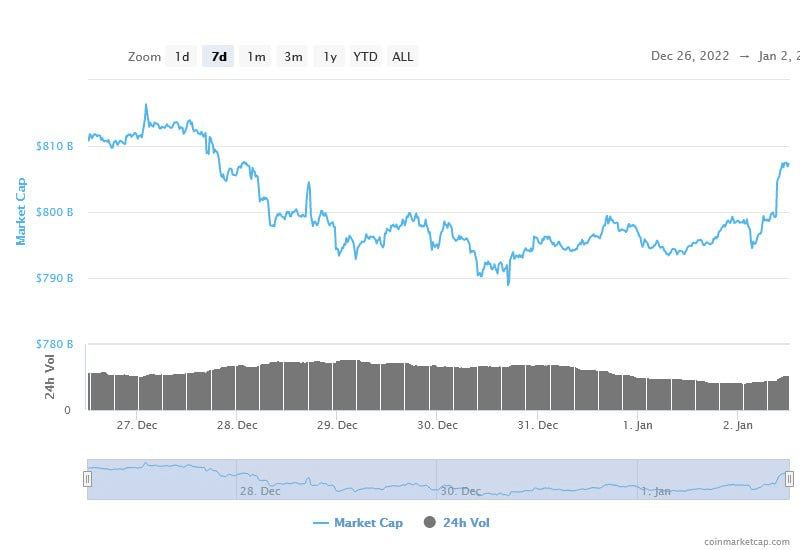
It is worth mentioning that the crypto market briefly reclaimed the $1 trillion market capitalization towards the end of 2022 after getting a boost from positive macroeconomic-related news.
Furthermore, the crypto market is still dictated by leading assets such as Bitcoin (BTC) and Ethereum (ETH), the two large cryptocurrencies by market capitalization. Notably, by press time, Bitcoin accounted for a market share of 39.9%, while Ethereum stood at 18.5%.
Ethereum (ETH) has also reclaimed the $1,200 position, trading at 1,216 by press time with gains of about 1.64% in the last 24 hours. Although the market remains in a consolidation phase, other notable cryptocurrencies to record gains in the last 24 hours include XRP at 1.5%, Dogecoin (DOGE) at 3%, and Cardano (ADA) at 3%.
Bitcoin registers minor rally
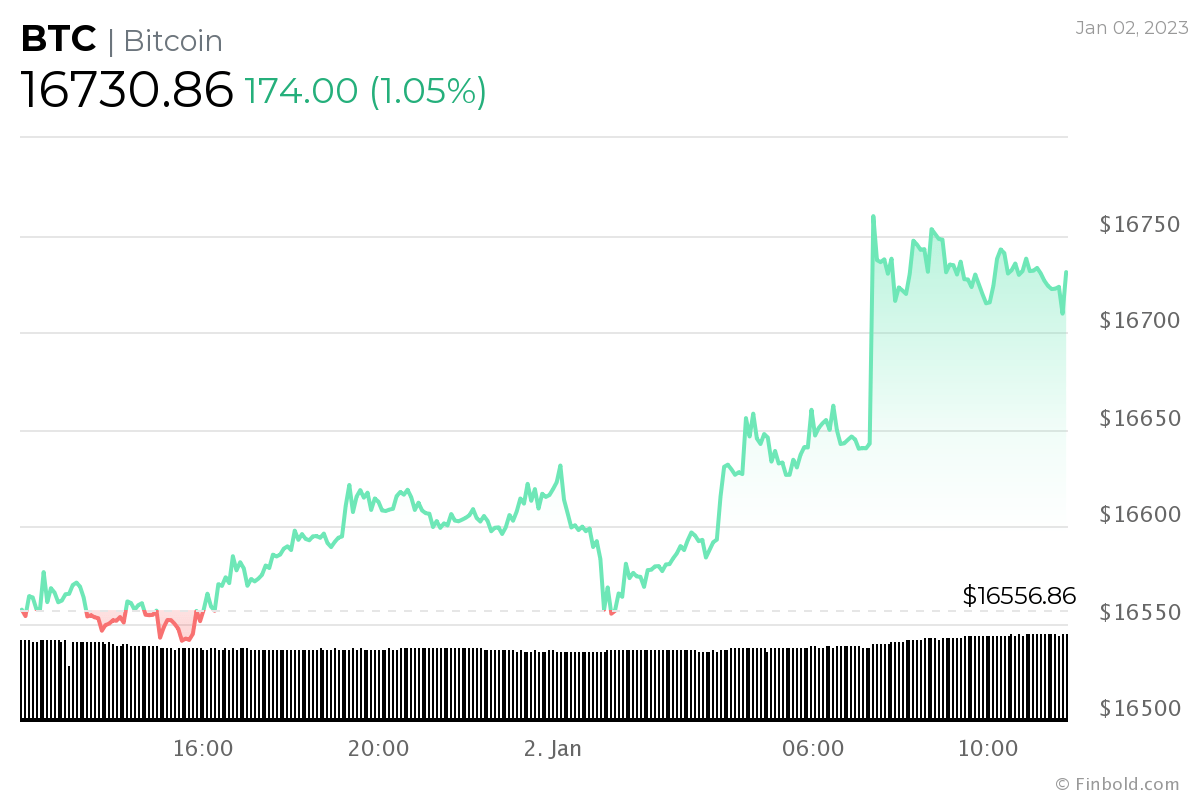
Bitcoin is still attempting to reclaim the $17,000 level after days of a sideway trading pattern. By press time, the flagship cryptocurrency was trading at $16,730, with gains of about 1% in the last 24 hours.
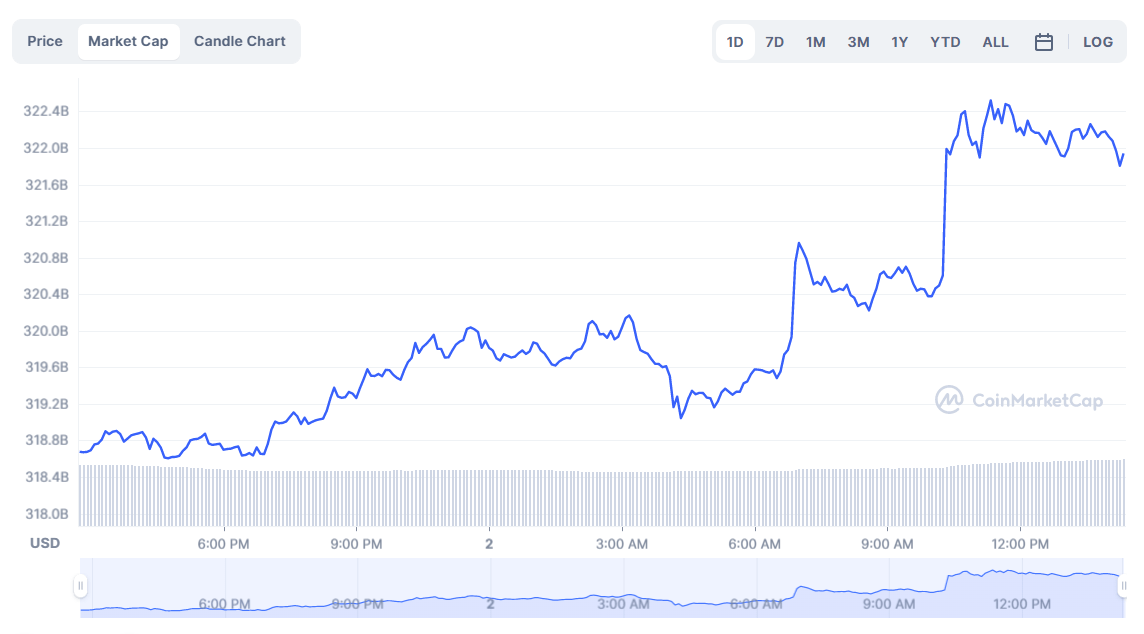
Similarly, the asset has witnessed increased buying pressure culminating in a market capitalization of $322.08 billion as of January 2. In the last 24 hours, Bitcoin has attracted $3.38 billion in capital inflow.
Bitcoin 2023 outlook
Although 2023 is still in its infancy stages, several industries have shared varied views on how Bitcoin’s price movement will play out. In this line, David Kemmerer, CEO of crypto tax software CoinLedger, projected that Bitcoin might correct further in the first half of the year.
In contrast, pseudonymous crypto and stock market analyst Trend Rider noted that Bitcoin could take a bullish turn in the first half of 2023. Elsewhere, Stefan Ristic, a crypto miner operating BitcoinMiningSoftware.com, also believes Bitcoin might be bearish in 2023, but he expects next year’s halving event to act as a catalyst for a rally in 2025.
Disclaimer: The content on this site should not be considered investment advice. Investing is speculative. When investing, your capital is at risk.


 Bitcoin
  Ethereum
  Tether
  USDC
USDC  Dogecoin
  Cardano
  Bitcoin Cash
  LEO Token
  Stellar
  Litecoin
  Hedera
  OKB
OKB  Gate
Gate  VeChain
  Cosmos Hub
  Algorand
  KuCoin
  Tether Gold
  Zcash
Zcash  IOTA
IOTA  TrueUSD
  NEO
NEO  Polygon
  Ravencoin
  Decred
  Synthetix Network
  0x Protocol
  Basic Attention
  Siacoin
  Status
  Holo
Holo  DigiByte
  Nano
Nano  Enjin Coin
  Ontology
  Waves
Waves  Pax Dollar
  Steem
Steem  Numeraire
  BUSD
BUSD  OMG Network
  Ren
Ren  Augur
Augur  HUSD
HUSD  Bitcoin Diamond