


Bitcoin Price Analysis: BTC Could Rally Above This Resistance
- Bitcoin price is attempting a fresh increase from the $25,400 zone against the US Dollar.
- The price is now trading below $26,500 and the 55 simple moving average (4 hours).
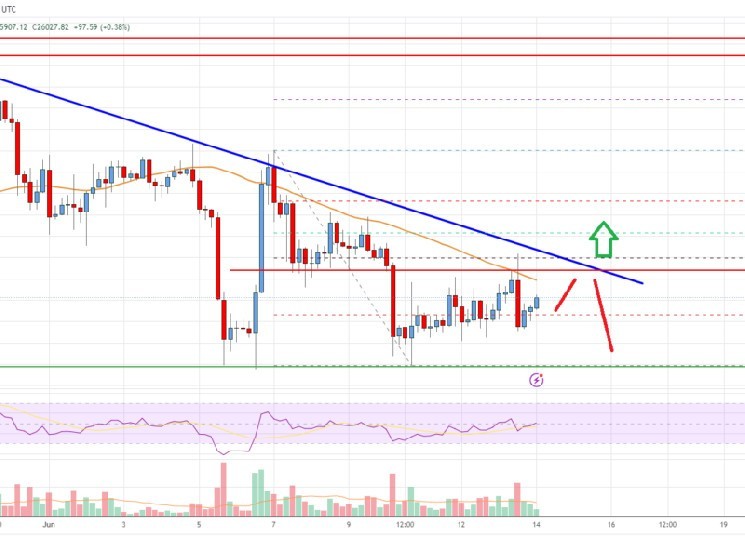
- There is a major bearish trend line forming with resistance near $26,300 on the 4-hour chart of the BTC/USD pair (data feed from Coinbase).
- The pair could start a fresh increase if it clears the $26,400 resistance zone.
Bitcoin price is rising from $25,400 against the US Dollar. BTC might eye another increase if the bulls remain active above the $26,400 zone.
Bitcoin Price Analysis
Bitcoin price remained well-bid above the $25,400 level. A base was formed and the price was able to avoid more losses below the $25,400 level. The bulls remained active and were able to slowly push the price above the $26,000 level.
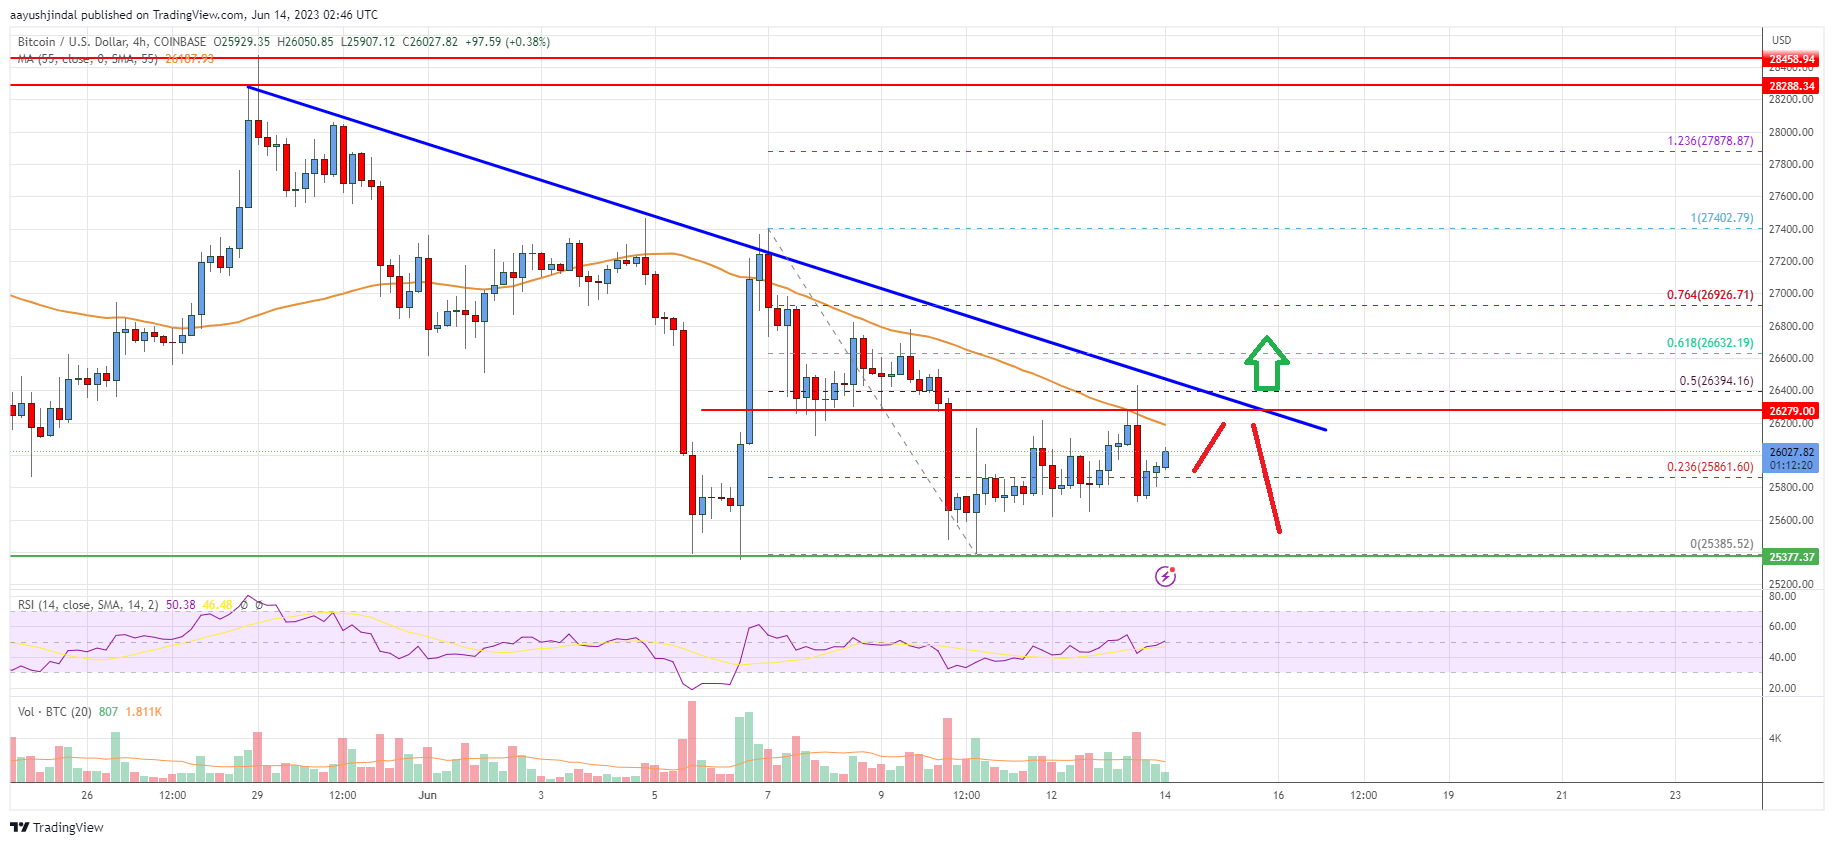
There was a move above the 23.6% Fib retracement level of the recent drop from the $27,402 swing high to the $25,385 low. Bitcoin price is now trading below $26,500 and the 55 simple moving average (4 hours).
Immediate resistance on the upside is near the $27,200 level. There is also a major bearish trend line forming with resistance near $26,300 on the 4-hour chart of the BTC/USD pair. The trend line is just below the 50% Fib retracement level of the recent drop from the $27,402 swing high to the $25,385 low.
The next major resistance might be near the $26,640 zone. A clear move above the $26,400 and $26,640 resistance levels might send the price toward $27,500.
Any more gains might push the price toward the $28,000 zone. If there is no upside break, the price might start a fresh decline below the $26,000 level. The first major support is near $25,550. The next key support is near the $25,400 level, below which the price might accelerate lower. In the stated case, the price could decline toward the $25,000 level in the coming sessions.
Bitcoin Price
Looking at the chart, Bitcoin’s price is trading below $26,500 and the 55 simple moving average (4 hours). Overall, the price could start a fresh increase if it clears the $26,400 resistance zone.
Technical Indicators
4 hours MACD – The MACD is now losing momentum in the bearish zone.
4 hours RSI (Relative Strength Index) – The RSI is now above the 50 level.
Key Support Levels – $25,550 and $25,400.
Key Resistance Levels – $26,200, $26,350, and $26,500.


 Bitcoin
  Ethereum
  Tether
  USDC
USDC  Dogecoin
  Cardano
  Bitcoin Cash
  Polygon
  Litecoin
  LEO Token
  Hedera
  Stellar
  Cosmos Hub
  OKB
OKB  Maker
Maker  Algorand
  NEO
NEO  Gate
Gate  KuCoin
  Synthetix Network
  IOTA
IOTA  Tether Gold
  TrueUSD
  Enjin Coin
  Ravencoin
  Holo
Holo  0x Protocol
  Siacoin
  Basic Attention
  Zcash
Zcash  Ontology
  Decred
  Waves
Waves  Lisk
Lisk  DigiByte
  Status
  Numeraire
  Nano
Nano  Pax Dollar
  Steem
Steem  OMG Network
  BUSD
BUSD  Ren
Ren  Bytom
Bytom  Bitcoin Diamond
  HUSD
HUSD  Energi
  Augur
Augur