

Saudi Arabia cuts ties with the U.S. for economic independence
In a surprising move, Saudi Arabia and the OPEC+ group of producers have announced a cut in oil production of approximately 1.6 million barrels per day.
While the move is aimed at achieving market stability, according to a recent report from the Financial Times, Saudi Arabia is attempting to adopt an economic strategy that is independent of the United States.
Saudi’s unexpected cut in oil production
The decision to cut oil production comes as a surprise, particularly as it is lower than the expected reduction of 2 million barrels per day that was to be agreed upon during the meeting that included Saudi Arabia and Russia.
Scheduled to commence in May, the announced voluntary reductions in production supplement previously established cuts agreed upon in October. Riyadh has officially stated that it will curtail output by 500,000 barrels per day, while Iraq will decrease its production by 211,000 barrels per day.
Other countries have also announced production cuts, with the United Arab Emirates cutting 144,000 barrels per day, Kuwait reducing its output by 128,000 barrels per day, Oman cutting 40,000 barrels per day, Algeria reducing production by 48,000 barrels per day, and Kazakhstan planning to decrease its output by 78,000 barrels per day.
Economic independence from the U.S.
According to the Financial Times report, the decision to adopt an economic strategy independent of the United States is due to declining relations between Riyadh and Washington during the Biden administration.
Last week, the Biden administration ruled out new crude purchases in an effort to refill a stockpile that was drained last year, and this was also reported to be an effort by the White House to curb inflation.
RBC Capital Markets Head of Commodity Strategy, Helima Croft, stated that Saudi Arabia was going to adopt an economic strategy without dependence on the US.
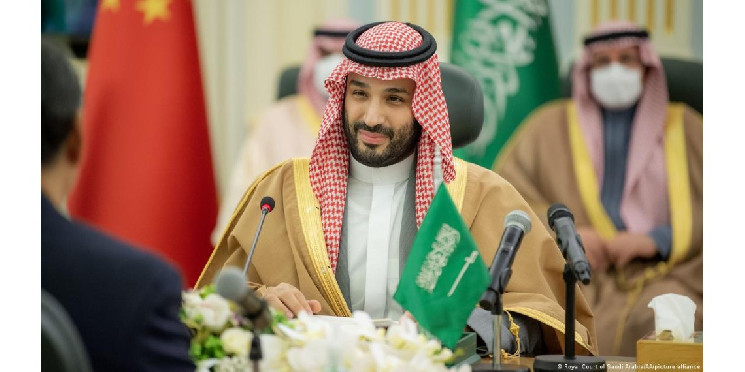
Saudi Arabia’s growing ties with China
Saudi Arabia has recently been granted the status of a dialogue partner in the Shanghai Cooperation Organization (SCO), a China-led Asian security and economic bloc that includes Russia, India, Pakistan, and other major economic players. The kingdom could eventually be granted full membership.
The move is part of Saudi Arabia’s efforts to diversify its global partnerships. This month alone, Beijing mediated a landmark agreement between archfoes Iran and Saudi Arabia that could help significantly ease Middle East tensions.
Saudi Arabia also announced a $3.6 billion deal to buy 10% of China’s Rongsheng Petrochemical, which would see it supply 480,000 barrels per day of crude oil to the company.
The decision by Saudi Arabia to adopt an economic strategy independent of the United States could have significant implications for the U.S. and its relationship with the Middle East. As the U.S.’ rivalry with China and Russia intensifies in an increasingly polarized world, Saudi Arabia and other Middle Eastern nations are choosing to diversify their global partnerships.
While states like Saudi Arabia may be getting closer to China, Beijing is far from becoming a U.S. rival in the region. According to Saudi analyst and writer Ali Shihabi:
The traditional monogamous relationship with the U.S. is now over, and we have gone into a more open relationship; strong with the US but equally strong with China, India, (the) UK, France and others.


 Bitcoin
  Ethereum
  Tether
  USDC
USDC  Dogecoin
  Cardano
  Bitcoin Cash
  LEO Token
  Stellar
  Litecoin
  Hedera
  OKB
OKB  Gate
Gate  Cosmos Hub
  VeChain
  Algorand
  KuCoin
  Tether Gold
  Zcash
Zcash  IOTA
IOTA  TrueUSD
  NEO
NEO  Polygon
  Decred
  Ravencoin
  Synthetix Network
  0x Protocol
  Basic Attention
  Siacoin
  Holo
Holo  DigiByte
  Status
  Nano
Nano  Enjin Coin
  Ontology
  Waves
Waves  Pax Dollar
  Steem
Steem  BUSD
BUSD  Numeraire
  OMG Network
  Ren
Ren  Augur
Augur  HUSD
HUSD  Bitcoin Diamond