

Key Indicator of Bitcoin Market Profitability Turns Bearish – Here’s What That Means for the BTC Price
A key indicator of profitability in the Bitcoin market just turned negative, a bearish sign according to some analysts. In wake of Bitcoin’s latest price dip back to the $22,000 area, the 30-day Simple Moving Average of the average Spent Output Profit Ratio (aSOPR) recently fell back below 1, as seen in the below chart presented by crypto data analytics firm Glassnode.
This signifies that the Bitcoin market is now, on average, realizing losses in on-chain spends, explains Glassnode. The crypto data firm says that when the aSOPR is above 1 this generally “aligns with both a healthier inflow of demand (to absorb profit taking), and a more constructive opinion of the asset”.
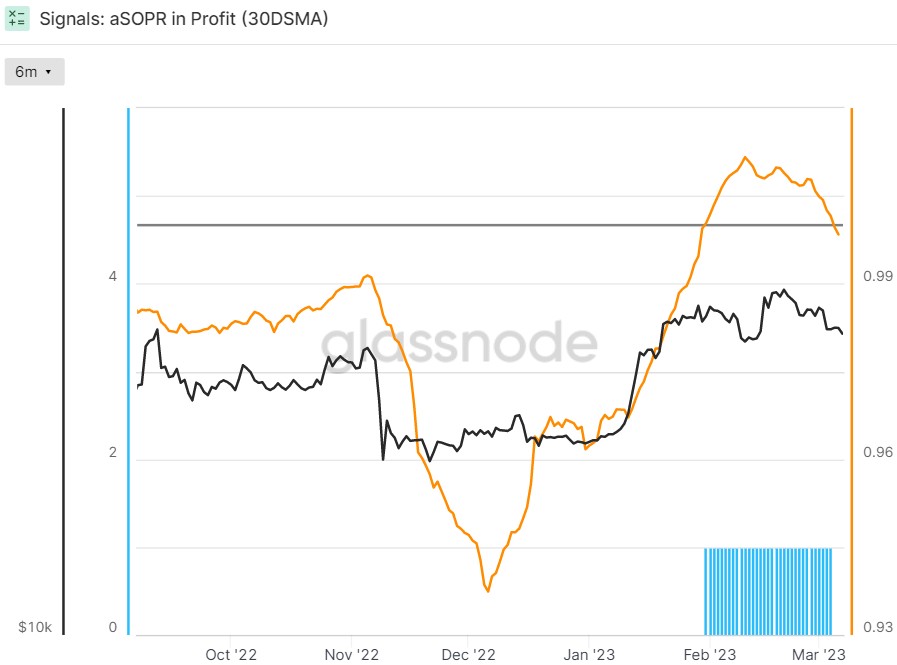
The aSOPR only considers the profit/loss on a per spent output basis and not coin volume, meaning that it gives equal weight to shrimps and whales, which Glassnode says means it provides a “view of the widest cross-section of the market”. Glassnode uses a 30-day Simple Moving Average when looking at this indicator in order to provide a slower but higher conviction market signal.
Another Key Profitability Indicator Could Also Soon Turn Negative
If downside in the Bitcoin price extends in the coming days and weeks, as many now fear is a likelihood in wake of key technical support being broken and Fed Chair Jerome Powell’s latest hawkish surprise, then another key indicator of profitability in the Bitcoin market will likely also turn negative.
The 30-Day Simple Moving Average of Glassnode’s Realized Profit and Loss (P/L) Ratio has been falling in recent days and if the current rate continues, could drop under 1.0 later this week. When the Realized P/L Ratio is above 1.0, this “signifies that the market is now realizing a greater proportion of USD-denominated profits, than losses,” Glassnode explains.
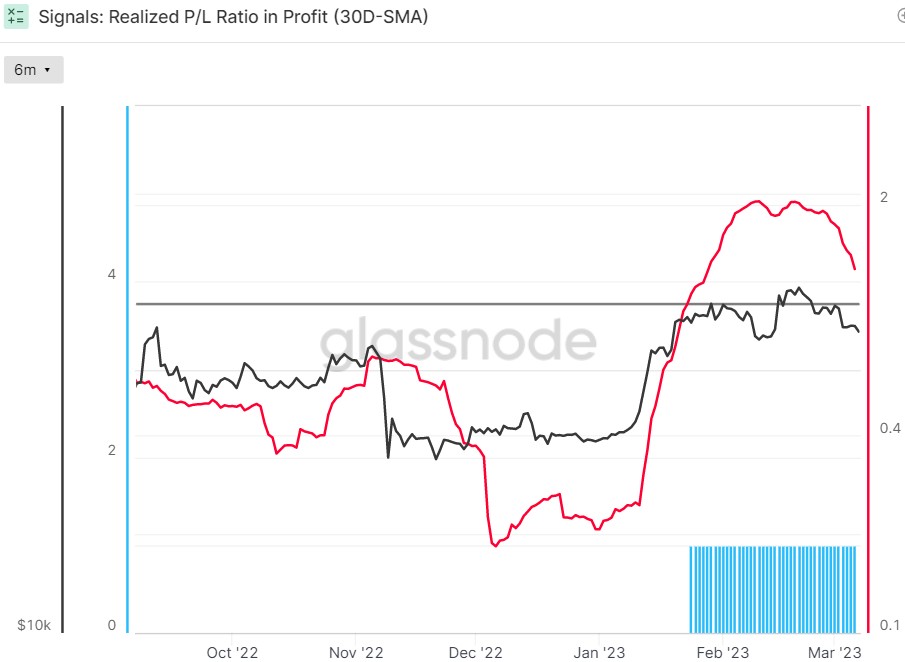
“Unlike the aSOPR model above, this indicator accounts for the total realized profit/loss”, Glassnode continues, before adding that this means that “larger transactors (like whales) will carry greater influence than smaller ones (like shrimp)”.
On-Chain Picture Becoming Less Bullish
If the Realized P/L Ratio is to join the aSOPR in falling below 1.0, this would mean that only five out of eight of the on-chain and technical indicators tracked by analysts at Glassnode in their “Recovering From a Bitcoin Bear” dashboard would still be flashing a bullish sign.
To recap, the dashboard tracks eight indicators to ascertain whether Bitcoin is trading above key pricing models, whether or not network utilization momentum is increasing, whether market profitability is returning and whether the balance of USD-denominated Bitcoin wealth favors the long-term HODLers.
When all eight are flashing green, this has historically been a strong bullish sign for the Bitcoin market. But, amid the Bitcoin market’s recent struggles as the pullback from recent $25,000 highs extends, the dashboard continues to fail to send a convincing bull signal.
Amid ongoing macro headwinds, Bitcoin bulls should likely temper their optimism about the cryptocurrency’s near-term prospects. Yes, there are a lot of signs that the bear market of 2022 is now over, given conditions became excessively oversold last November and December. But it likely remains to early to call for a near-term surge back towards 2022 highs in the upper $48,000s.


 Bitcoin
  Ethereum
  Tether
  USDC
USDC  Dogecoin
  Cardano
  Stellar
  Bitcoin Cash
  LEO Token
  Hedera
  Litecoin
  Zcash
Zcash  OKB
OKB  Tether Gold
  Gate
Gate  KuCoin
  Algorand
  Cosmos Hub
  VeChain
  IOTA
IOTA  TrueUSD
  Synthetix
  NEO
NEO  Decred
  Basic Attention
  0x Protocol
  Ravencoin
  Siacoin
  DigiByte
  Numeraire
  Nano
Nano  Ontology
  Enjin Coin
  Waves
Waves  Status
  Pax Dollar
  BUSD
BUSD  Steem
Steem  OMG Network
  Augur
Augur