Technical analysis of Ethereum (ETH) price — 27/10/22

Crypto Industry News:
Merge Ethereum was a landmark event. Many people agreed that this is undoubtedly one of the key events in history — not only Ethereum, but all cryptocurrencies. Some expected the mechanism to change from proof-of-work to proof-of-stake. Many people also expected increases, and some thought that changing the mechanism could cause Ethereum to dethrone Bitcoin.
However, after Merge, we saw declines instead of increases. And since around September 20 it has been in consolidation, only yesterday we could notice a bigger move.
The transition to the proof-of-stake mechanism was to reduce the daily supply of ETH by approximately 90%. Inflation was supposed to be close to 0, and some expected deflation. The smaller supply combined with low inflation made the market expect increases. Some expected a «supply shock», ie a situation where there are many buyers but a shortage of resources in the market.
Why has there not been and will not be (at least for now) huge increases? Above all, cryptocurrency prices are also influenced by market expectations for the future. And in front of Merge, the market was red-hot — expectations were enormous. With such moods, it is very easy to get disappointed and cause declines.
Additionally, it is worth noting that the macroeconomic sentiment is not conducive to growth. Raging inflation and rising interest rates are reflected in on risky assets, and this group includes cryptocurrencies.
Moreover, we observe an increased interest of politicians in regulations. Both the United States and the European Union are working on introducing cryptocurrency laws. And regulations have already been introduced by many countries, including South Korea, India, China.
Technical Market Outlook:
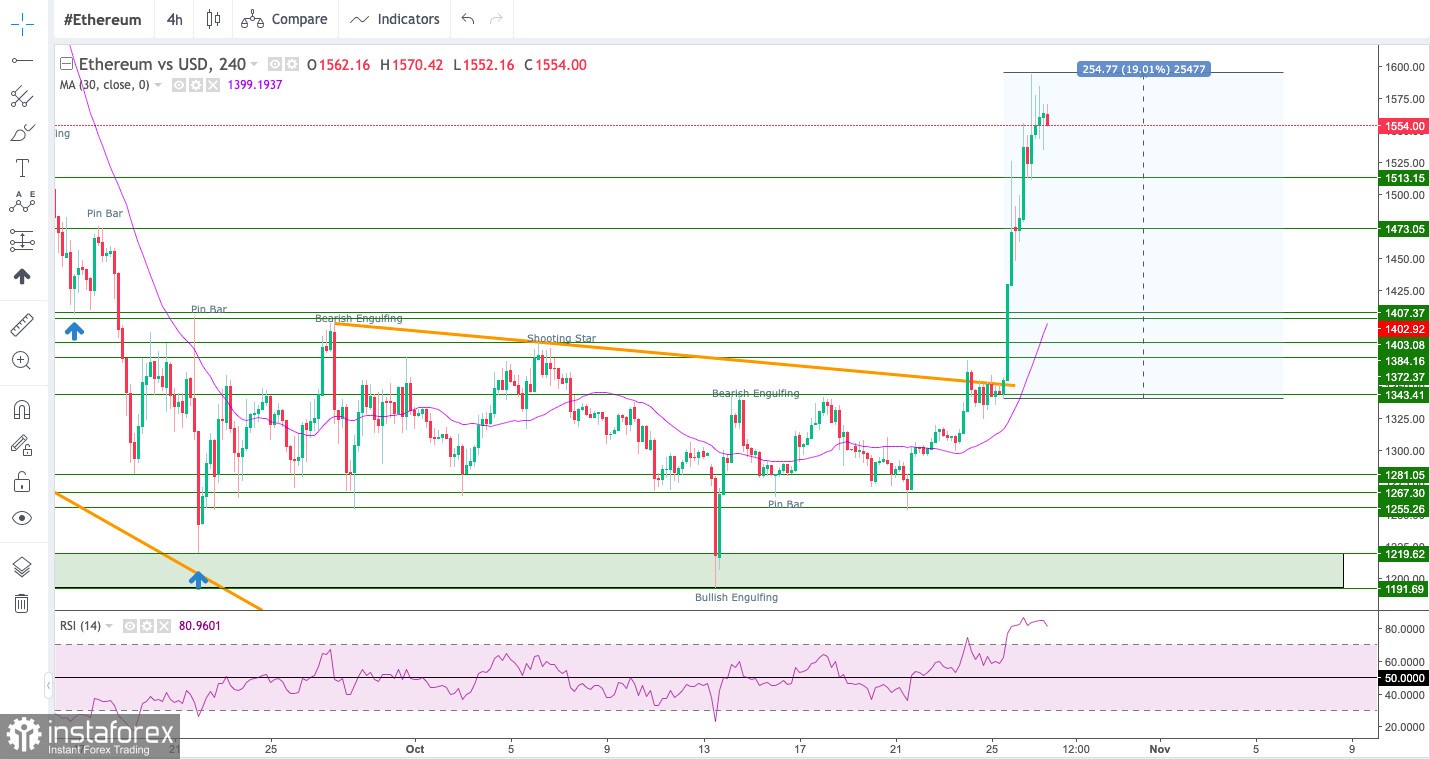
The ETH/USD pair had broken out from the consolidation zone and made a new local high at the level of $1,593 (at the time of writing the article). The Ethereum rally made so far over $254 (19%), so the breakout is strong and might extend even higher. The momentum on the H4 time frame chart had hit the extremely overbought market conditions, so the pull-back is imminent. The nearest technical support is seen at $1,473 and $1,513. The next target for bulls is seen at $1,645.

Weekly Pivot Points:
WR3 — $1,413
WR2 — $1,379
WR1 — $1,357
Weekly Pivot — $1,345
WS1 — $1,323
WS2 — $1,311
WS3 — $1,267
Trading Outlook:
The Ethereum market has been seen making lower highs and lower low since the swing high was made in the middle of the August at the level of $2,029. The key technical support for bulls is seen at $1,281 as a part of the demand zone located between the levels of $1,252 — $1,295. If the down move will be extended, then the next target for bears is located at the level of $1,000.
Relevance up to 09:00 2022-10-28 UTC+2 Company does not offer investment advice and the analysis performed does not guarantee results. The market analysis posted here is meant to increase your awareness, but not to give instructions to make a trade.


 Bitcoin
  Ethereum
  Tether
  USDC
USDC  TRON
TRON  Dogecoin
  Cardano
  Bitcoin Cash
  Chainlink
  Monero
  LEO Token
  Zcash
Zcash  Stellar
  Litecoin
  Hedera
  Dai
Dai  Cronos
  Tether Gold
  OKB
OKB  Ethereum Classic
  KuCoin
  Gate
Gate  Algorand
  Cosmos Hub
  VeChain
  TrueUSD
  Dash
Dash  Tezos
Tezos  Stacks
  IOTA
IOTA  Basic Attention
  Decred
  Theta Network
  NEO
NEO  Synthetix
  Qtum
Qtum  Ravencoin
  DigiByte
  0x Protocol
  Nano
Nano  Zilliqa
  Holo
Holo  Siacoin
  Numeraire
  Waves
Waves  BUSD
BUSD  Status
  Pax Dollar
  Enjin Coin
  Ontology
  Hive
Hive  Lisk
Lisk  Steem
Steem  Huobi
Huobi  NEM
NEM  OMG Network
  Bitcoin Gold
  Augur
Augur  Ren
Ren  HUSD
HUSD