


Ethereum Price Analysis: ETH Consolidates Below Key Resistance
- Ethereum price is struggling below the $1,850 resistance against the US Dollar.
- ETH price is now trading below $1,800 and the 55 simple moving average (4 hours).
- There is a major bearish trend line forming with resistance near $1,775 on the 4-hour chart (data feed from Coinbase).
- The pair could continue to move down if it stays below $1,775 and $1,800.
Ethereum price is declining below $1,800 against the US Dollar. ETH/USD remains at a risk of more downsides below the $1,720 support zone.
Ethereum Price Analysis
This past week, Ethereum started a fresh decline below $1,850 against the US Dollar. ETH price moved into a bearish zone below the $1,800 level.
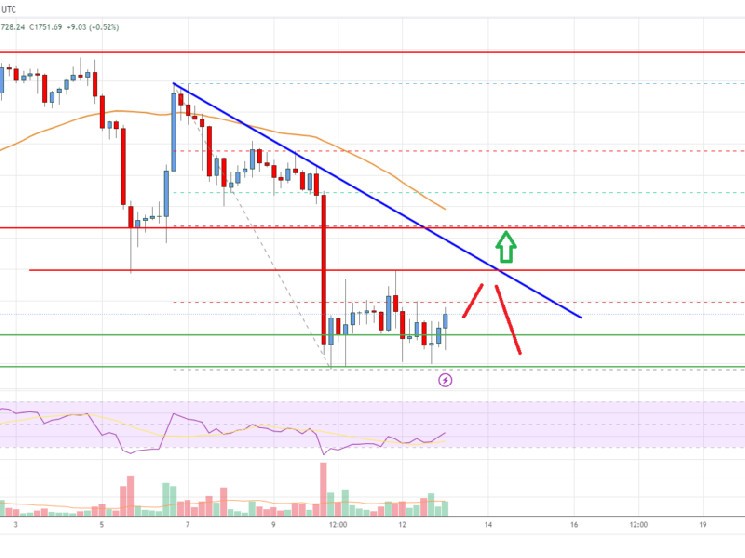
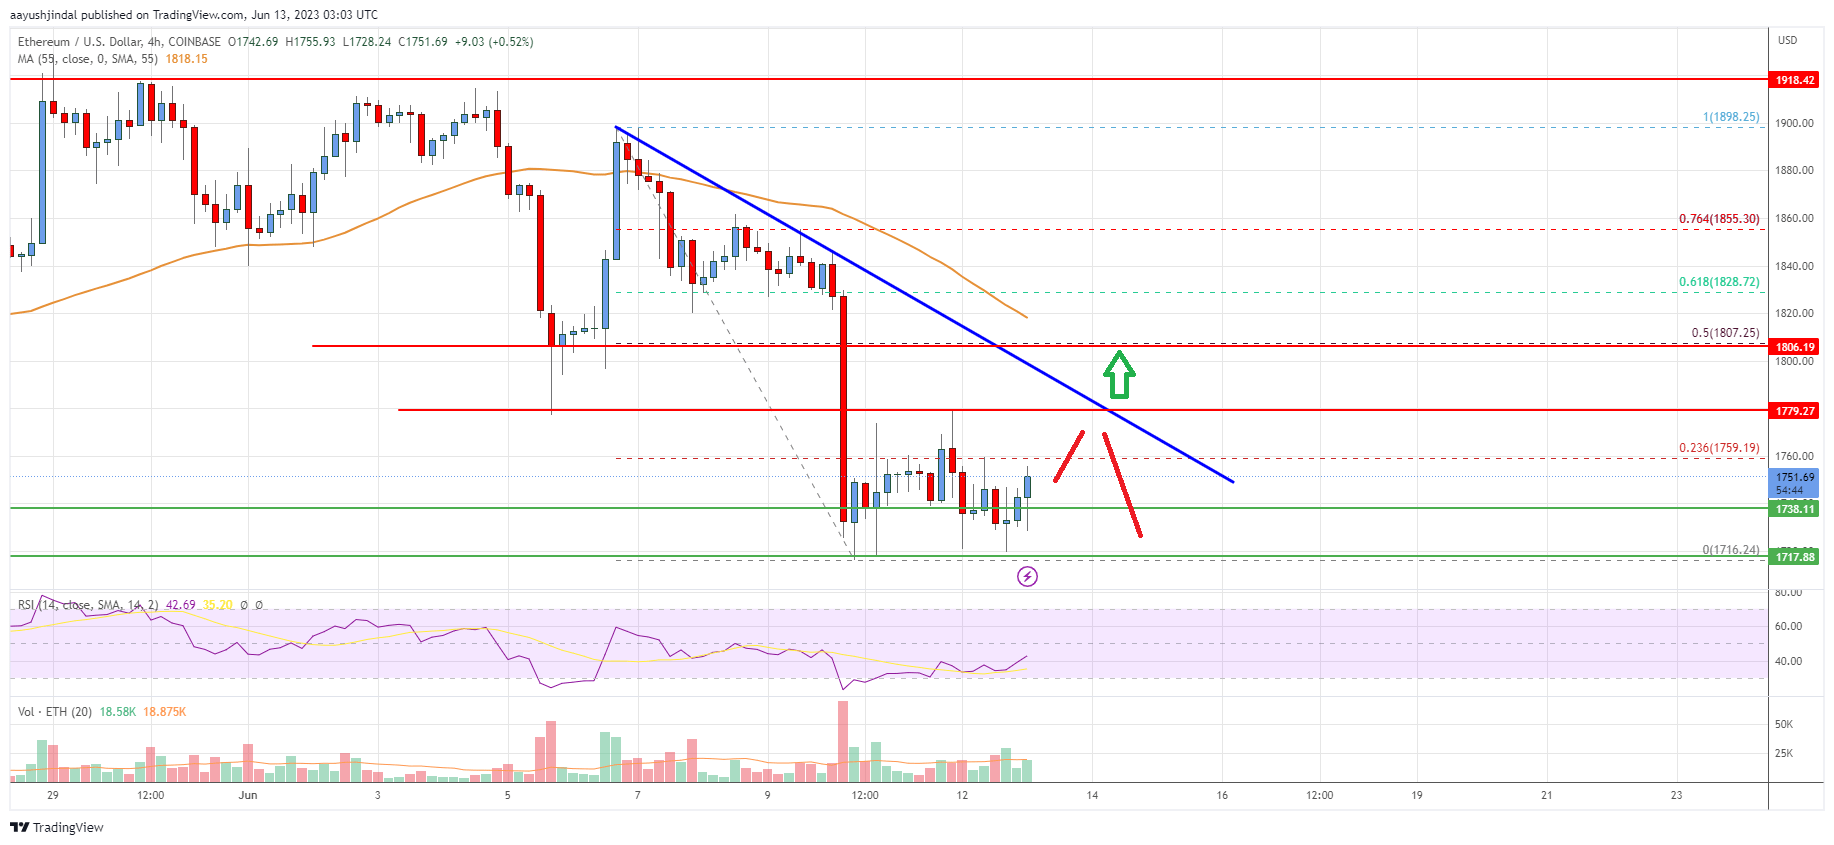
There was a sharp move below the $1,780 level. A low was formed near $1,716 before the price started an upside correction. The price climbed a few points higher above the $1,750 level. There was a spike above the 23.6% Fib retracement level of the downward move from the $1,898 swing high to the $1,716 low.
However, the price is still trading below $1,800 and the 55 simple moving average (4 hours). On the upside, the price is now facing resistance near the $1,760 level.
The next major resistance is near the $1,775 level. There is also a major bearish trend line forming with resistance near $1,775 on the 4-hour chart. A clear move above the $1,800 resistance or the 50% Fib retracement level of the downward move from the $1,898 swing high to the $1,716 low.
Any more gains could even send the price toward the $1,850 resistance zone or even $2,000 in the near term. On the downside, initial support is near the $1,720 level. The next major support is now near the $1,700 level. A break below the $1,700 support could push the price to $1,640. If the bulls fail to protect the $1,640 support, the price might decline toward $1,600.
Ethereum Price
Looking at the chart, Ethereum price is trading below $1,800 and the 55 simple moving average (4 hours). Overall, Ether’s price could continue to move down if it stays below $1,775 and $1,800.
Technical indicators
4 hours MACD – The MACD for ETH/USD is now losing momentum in the bearish zone.
4 hours RSI (Relative Strength Index) – The RSI for ETH/USD is now below the 50 level.
Key Support Levels – $1,720, followed by the $1,700 zone.
Key Resistance$ Levels – $1,775 and $1,800.


 Bitcoin
  Ethereum
  Tether
  USDC
USDC  Dogecoin
  Cardano
  Bitcoin Cash
  Polygon
  Litecoin
  LEO Token
  Hedera
  Stellar
  Cosmos Hub
  OKB
OKB  Maker
Maker  Algorand
  NEO
NEO  Gate
Gate  KuCoin
  Synthetix Network
  IOTA
IOTA  Tether Gold
  TrueUSD
  Enjin Coin
  Holo
Holo  Ravencoin
  0x Protocol
  Siacoin
  Basic Attention
  Zcash
Zcash  Ontology
  Decred
  Lisk
Lisk  Waves
Waves  DigiByte
  Status
  Numeraire
  Nano
Nano  Pax Dollar
  Steem
Steem  OMG Network
  BUSD
BUSD  Ren
Ren  Bytom
Bytom  Bitcoin Diamond
  HUSD
HUSD  Energi
  Augur
Augur