

Ethereum(ETH) Prices Dip Further by 0.84% Amidst Bear Influence

After encountering resistance at $1,222.20, the price of Ethereum (ETH) has been steadily declining over the last 24 hours, retracing to lows of $1,208.02 by 0.84%.
The decline in market capitalization and 1-day trading volume of 0.78% and 30.64%, respectively, to $147,885,939,434 and $6,441,941,911 reinforces this bearish momentum.
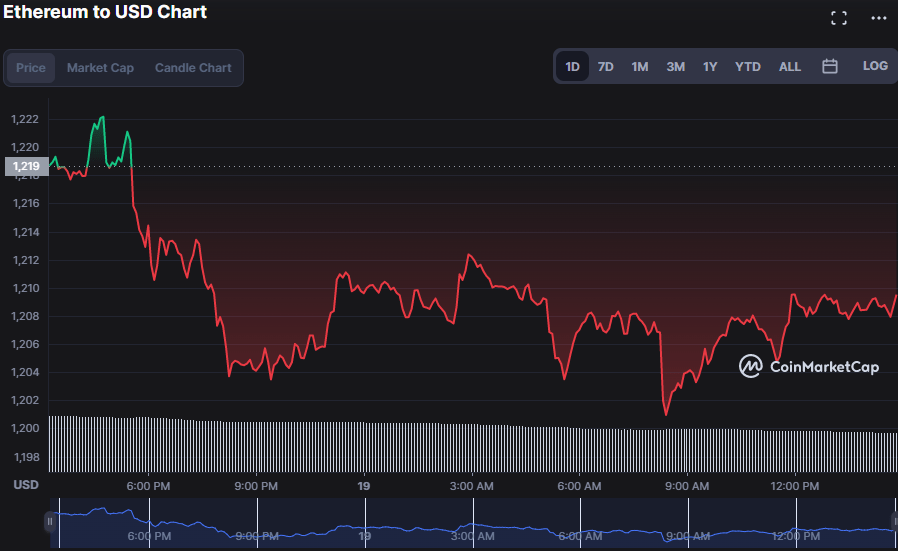
ETH/USD 24-hour price chart (Source: CoinMarketCap)
With a reading of -2.28, the Moving Average Convergence Divergence (MACD) forecasts a bullish turnaround as it makes a bullish crossover (crossing above the signal line). However, its movement in the negative territory indicates that the bears are still in control of the market; if the bulls continue to battle, this bear control may be invalidated.
The bullish turnaround on the ETH market is bolstered by the Bull Bear Power (BBP) moving into positive territory with a reading of 0.09. However, the Coppock Curve’s trend in the negative region with a reading of -0.83 dims this light.
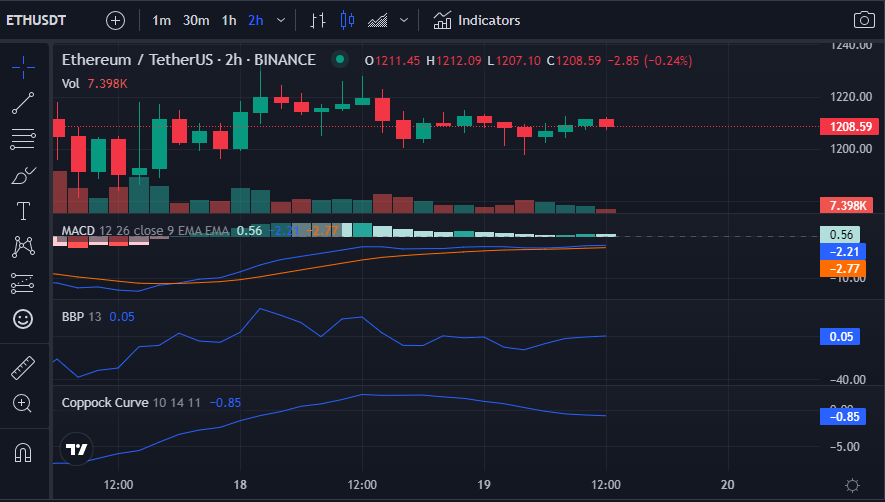
ETH/USD 2-hour price chart (Source: CoinMarketCap)
On the ETH 2-hour price chart, a bearish crossover occurs when the shorter MA crosses below the longer MA, with the 5-day MA touching 1207.80 and the 20-day MA touching 1211.19. The price action below both Moving Averages is propping up this negative trend.
With a reading of 49.57, the Stoch RSI suggests a possible bullish reversal because there is equal buying and selling pressure when it reads “50,” denoting that it is neither overbought nor oversold.
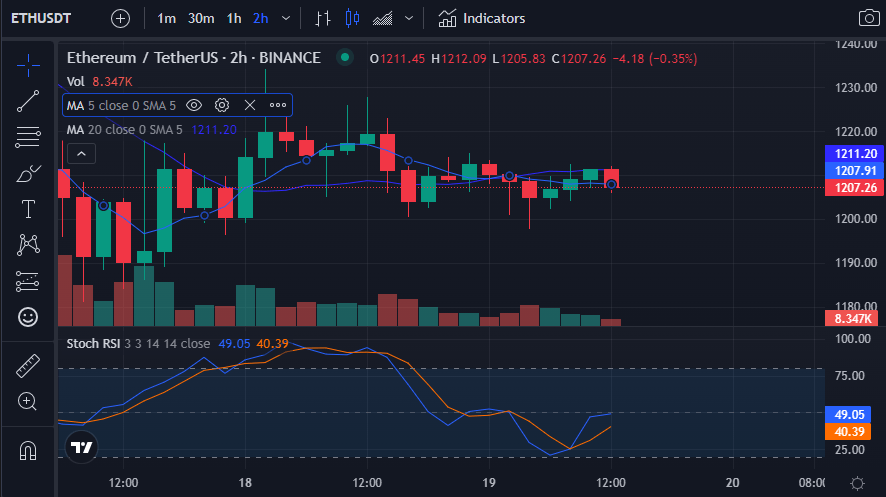
ETH/USD 2-hour price chart (Source: CoinMarketCap)
To counteract the bears and the present situation, the bulls must maintain the resistance level and drive prices higher.


 Bitcoin
  Ethereum
  Tether
  USDC
USDC  Dogecoin
  Cardano
  Bitcoin Cash
  Zcash
Zcash  LEO Token
  Stellar
  Litecoin
  Hedera
  Tether Gold
  OKB
OKB  KuCoin
  Gate
Gate  Algorand
  Cosmos Hub
  VeChain
  TrueUSD
  IOTA
IOTA  Decred
  Basic Attention
  NEO
NEO  Synthetix
  Ravencoin
  0x Protocol
  DigiByte
  Nano
Nano  Siacoin
  Numeraire
  Ontology
  Waves
Waves  Status
  BUSD
BUSD  Enjin Coin
  Pax Dollar
  Steem
Steem  OMG Network
  Augur
Augur  Ren
Ren