Crypto Expert Predicts Ethereum (ETH) Price; Time To Buy?

The price of Ethereum (ETH) is continuing to swing sideways as traders continue to be confused about whether or not the cryptocurrency market has reached its bottom. In the wake of the FTX scandal, analysts are of the opinion that the market has already reached its lowest point and a trend reversal is due.
Can Ethereum (ETH) Break Resistance?
While the price of Bitcoin is continuing to be under pressure due to worries of miner capitulation and bankruptcy filings, Ethereum is showing strength by gaining close to 9% in the past week with a possibility of rallying towards the $1,550 price zone.
With the U.S. Bureau of Labor Statistics today released November’s Consumer Price Index (CPI) data of 7.1%, down from 7.7% in October, Ethereum broke past $1300 to hit $1325 where it currently trades and faces stiff resistance.
Read More: US CPI Inflation Falls To 7.1%, Bitcoin And Ethereum Price Skyrockets
While the Ethereum (ETH) price shows strength at these levels and can hold on to it, traders and potential buyers can drive the price of the altcoin to revisit the $1420 mark, a 7.5% high from its current market price.
Furthermore, popular crypto analyst Michaël van de Poppe, predicts that Ethereum can even surpass the $1420 mark and potentially hit $1550, if it’s able to break past the resistance.
#Ethereum faces crucial resistance here, which is the area at $1,325 to break.
If that breaks, we can see $1,550, possibly.
Support to hold; $1,280-1,300. pic.twitter.com/eEdG3VJP86
— Michaël van de Poppe (@CryptoMichNL) December 14, 2022
Data Shows Price Rally Due
According to historical data, Ethereum has recorded consistent year-on-year (YoY) growth throughout the earlier three Christmases, with the last one being $4093 on December 25, 2021.
Read More: Analyst Predicts A Pull Back Before Bitcoin Bull Run
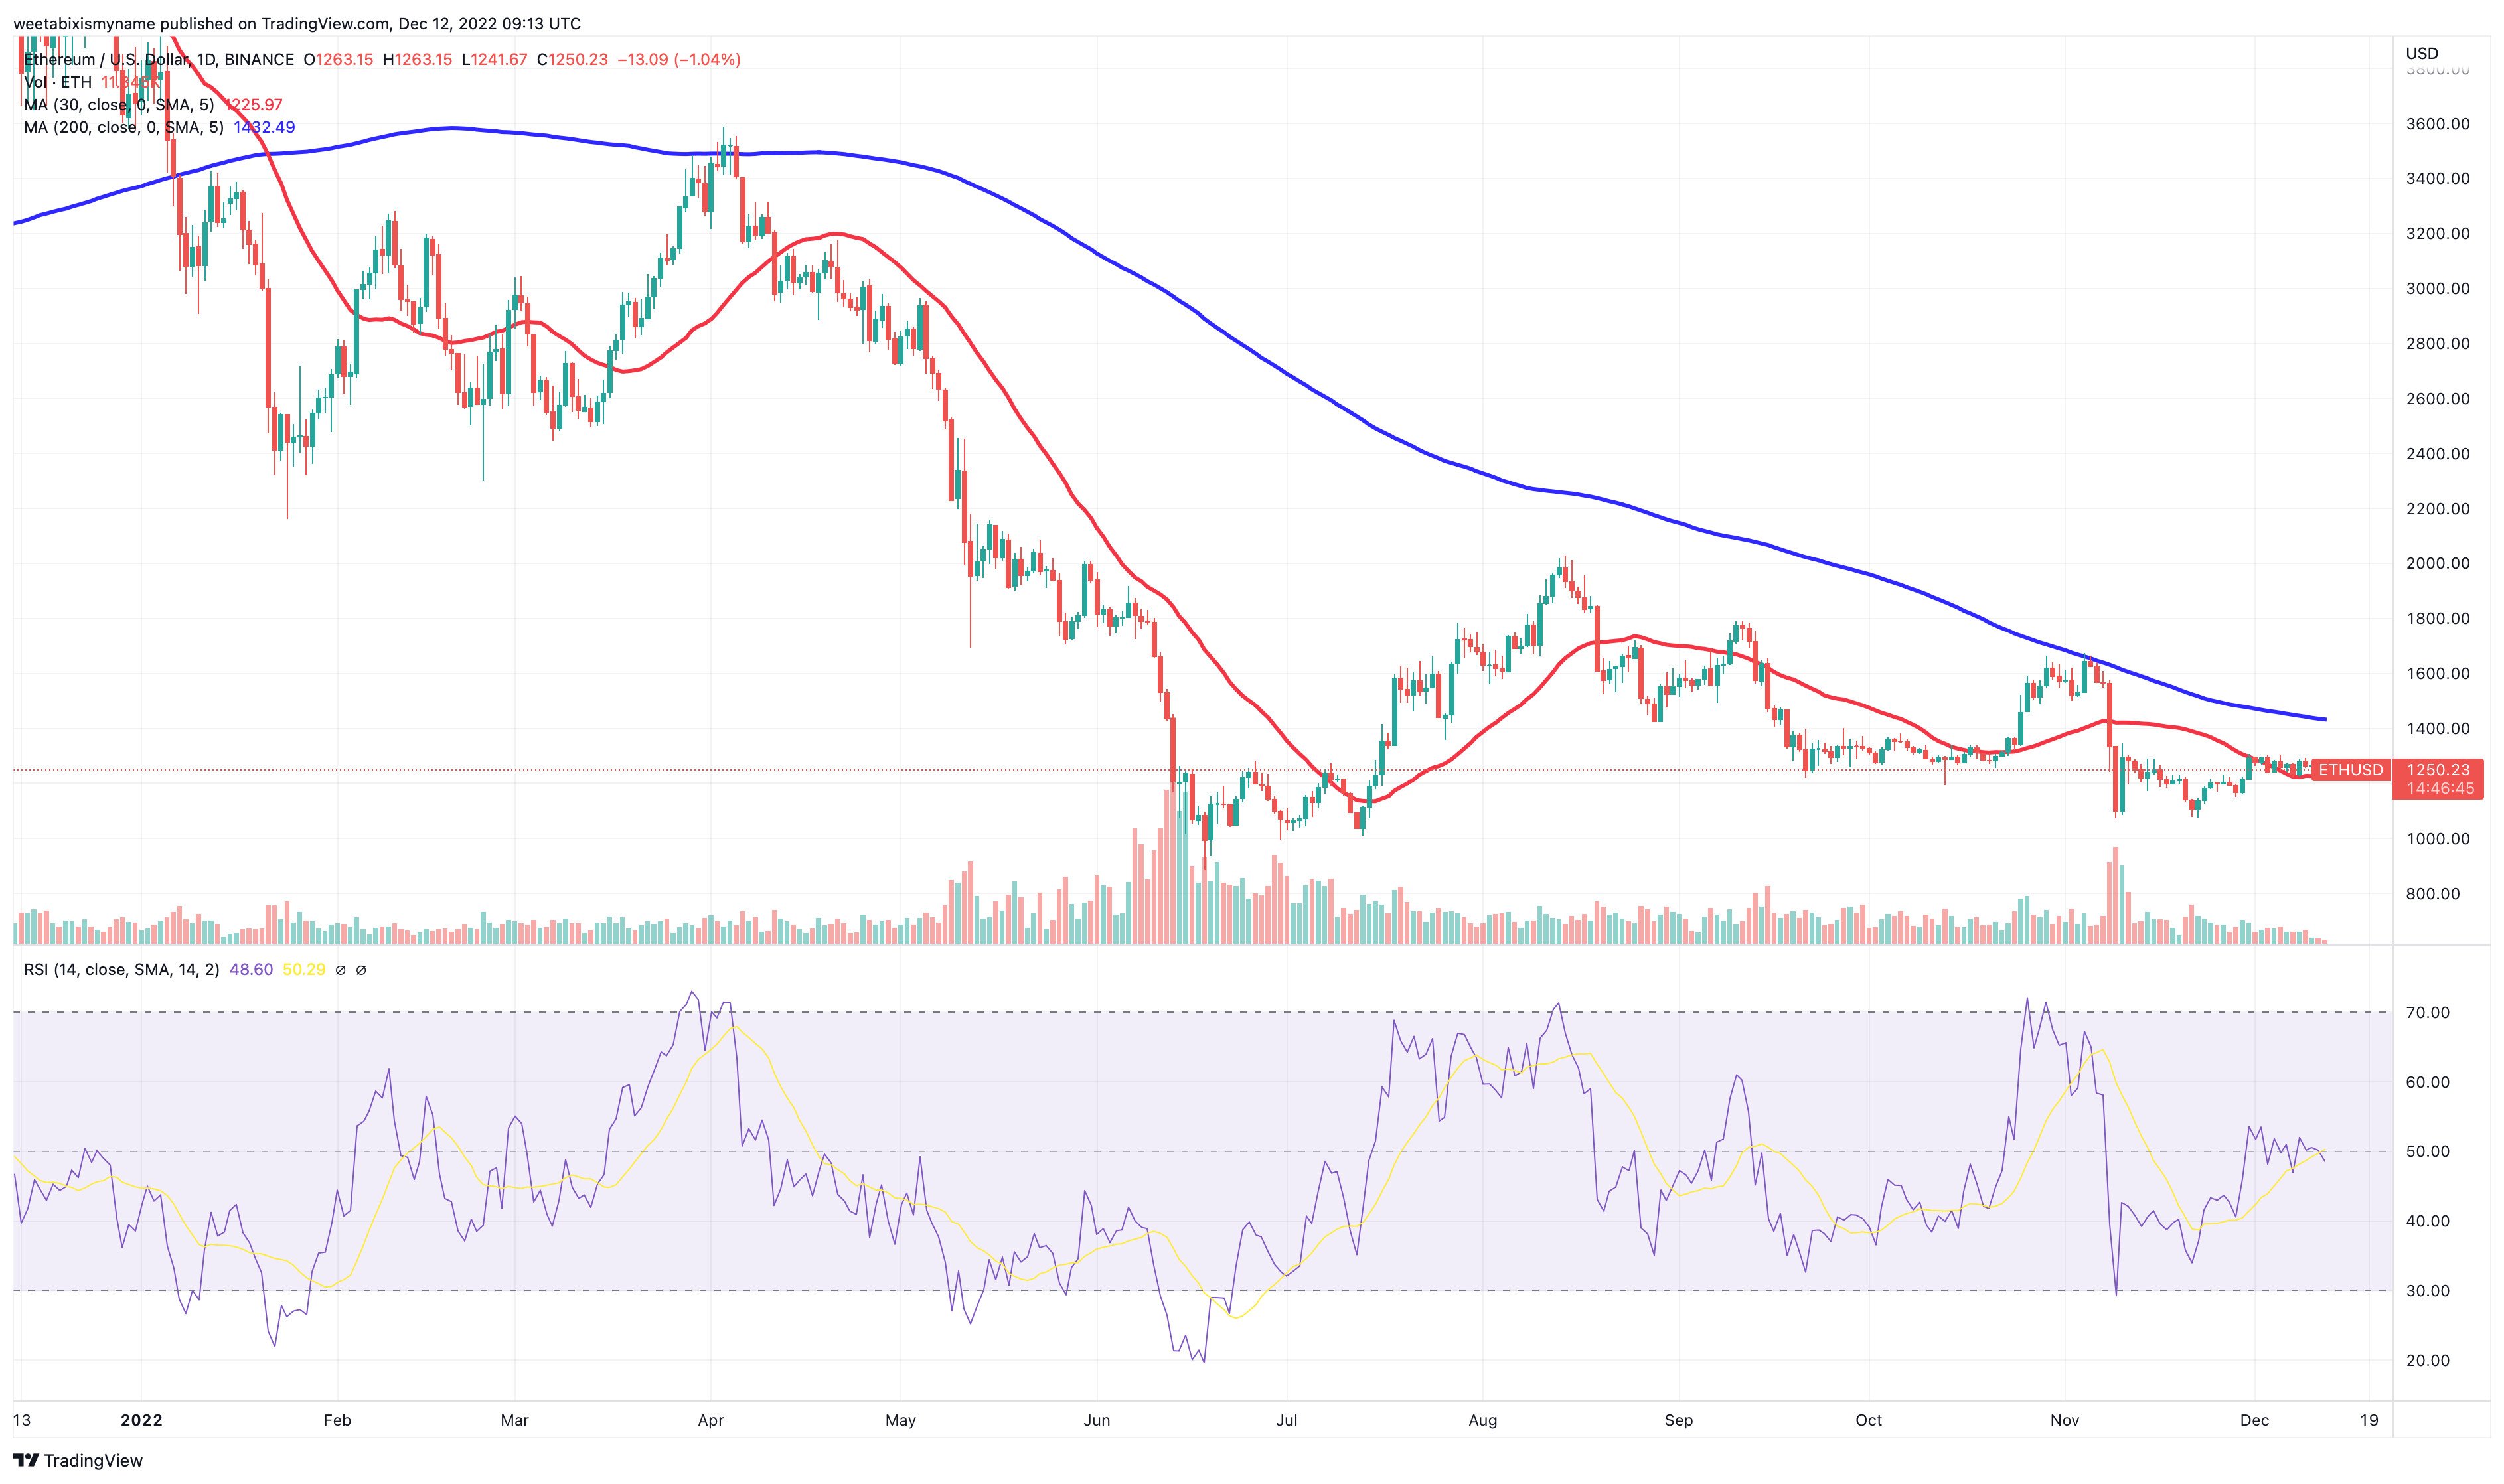
Also, if technical parameters are considered, the Ethereum chart clearly shows that the ETH price is due for a rally. Its relative strength index (shown in purple) dropped below 30 in early November and has now gradually been going up again.

In addition, ETH’s 30-day moving average (shown in red) has lagged behind its 200-day average (shown in blue) for the entirety of the year, indicating that a change towards more favourable price movement is long overdue.


 Bitcoin
  Ethereum
  Tether
  USDC
USDC  TRON
TRON  Dogecoin
  Cardano
  Monero
  Bitcoin Cash
  Chainlink
  LEO Token
  Stellar
  Zcash
Zcash  Litecoin
  Hedera
  Dai
Dai  Cronos
  OKB
OKB  Tether Gold
  Ethereum Classic
  KuCoin
  Cosmos Hub
  Gate
Gate  Algorand
  Dash
Dash  VeChain
  Stacks
  Tezos
Tezos  TrueUSD
  Decred
  IOTA
IOTA  Theta Network
  Basic Attention
  NEO
NEO  Synthetix
  Qtum
Qtum  0x Protocol
  Ravencoin
  Zilliqa
  DigiByte
  Nano
Nano  Holo
Holo  Siacoin
  Numeraire
  Waves
Waves  Ontology
  Status
  Enjin Coin
  BUSD
BUSD  Hive
Hive  Pax Dollar
  Lisk
Lisk  Steem
Steem  Huobi
Huobi  OMG Network
  Bitcoin Gold
  NEM
NEM  Augur
Augur