Bitcoin (BTC) Price Analysis for January 22
Most of the coins might need a correction before the next wave of growth.
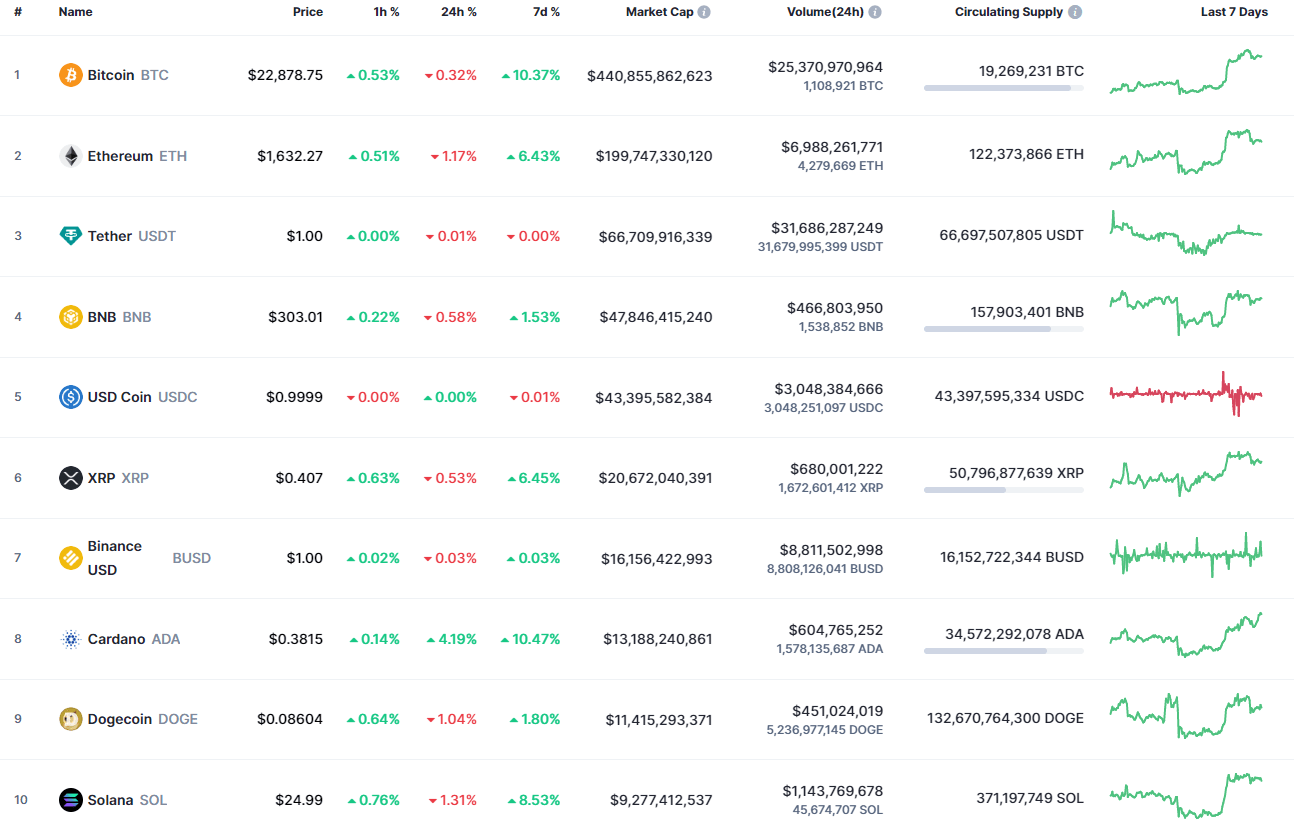
BTC/USD
Even though the price of Bitcoin (BTC) has dropped by 0.32% since yesterday, the rate has grown by more than 10% over the last week.
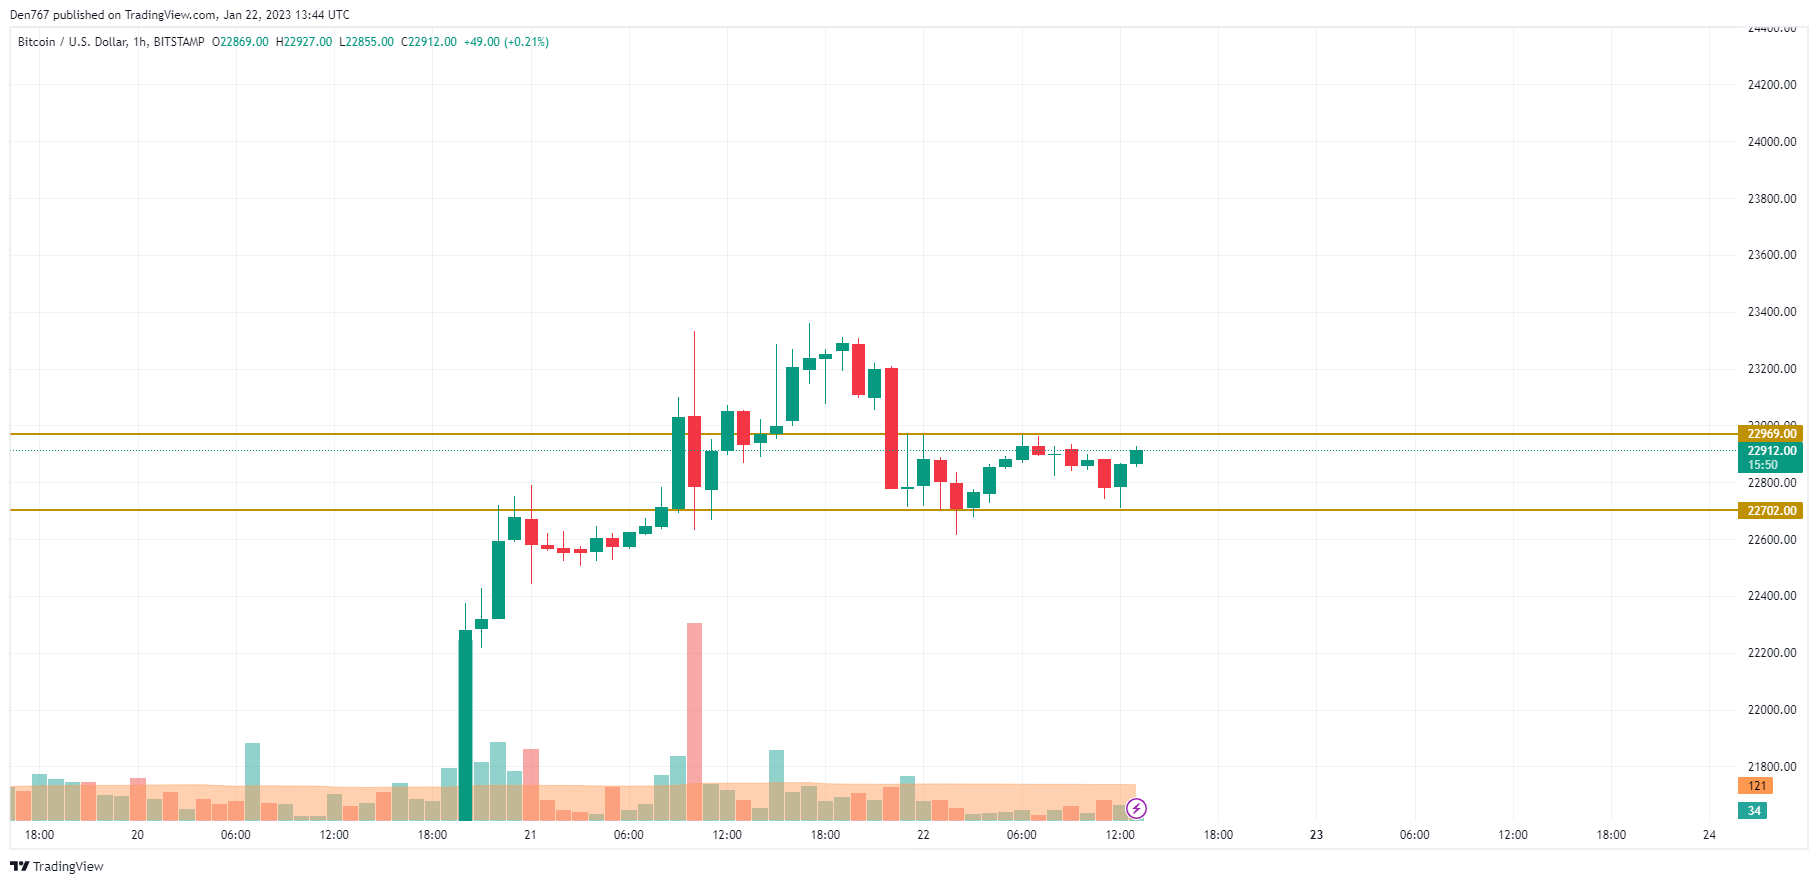
On the local chart, the price of Bitcoin (BTC) is in the narrow range between the support at $22,702 and the resistance at $22,969. At the moment, the rate is on the way to the upper line, which means that bulls are not going to give up.
In case of a breakout, the growth may continue to the $23,100-$23,200 zone.
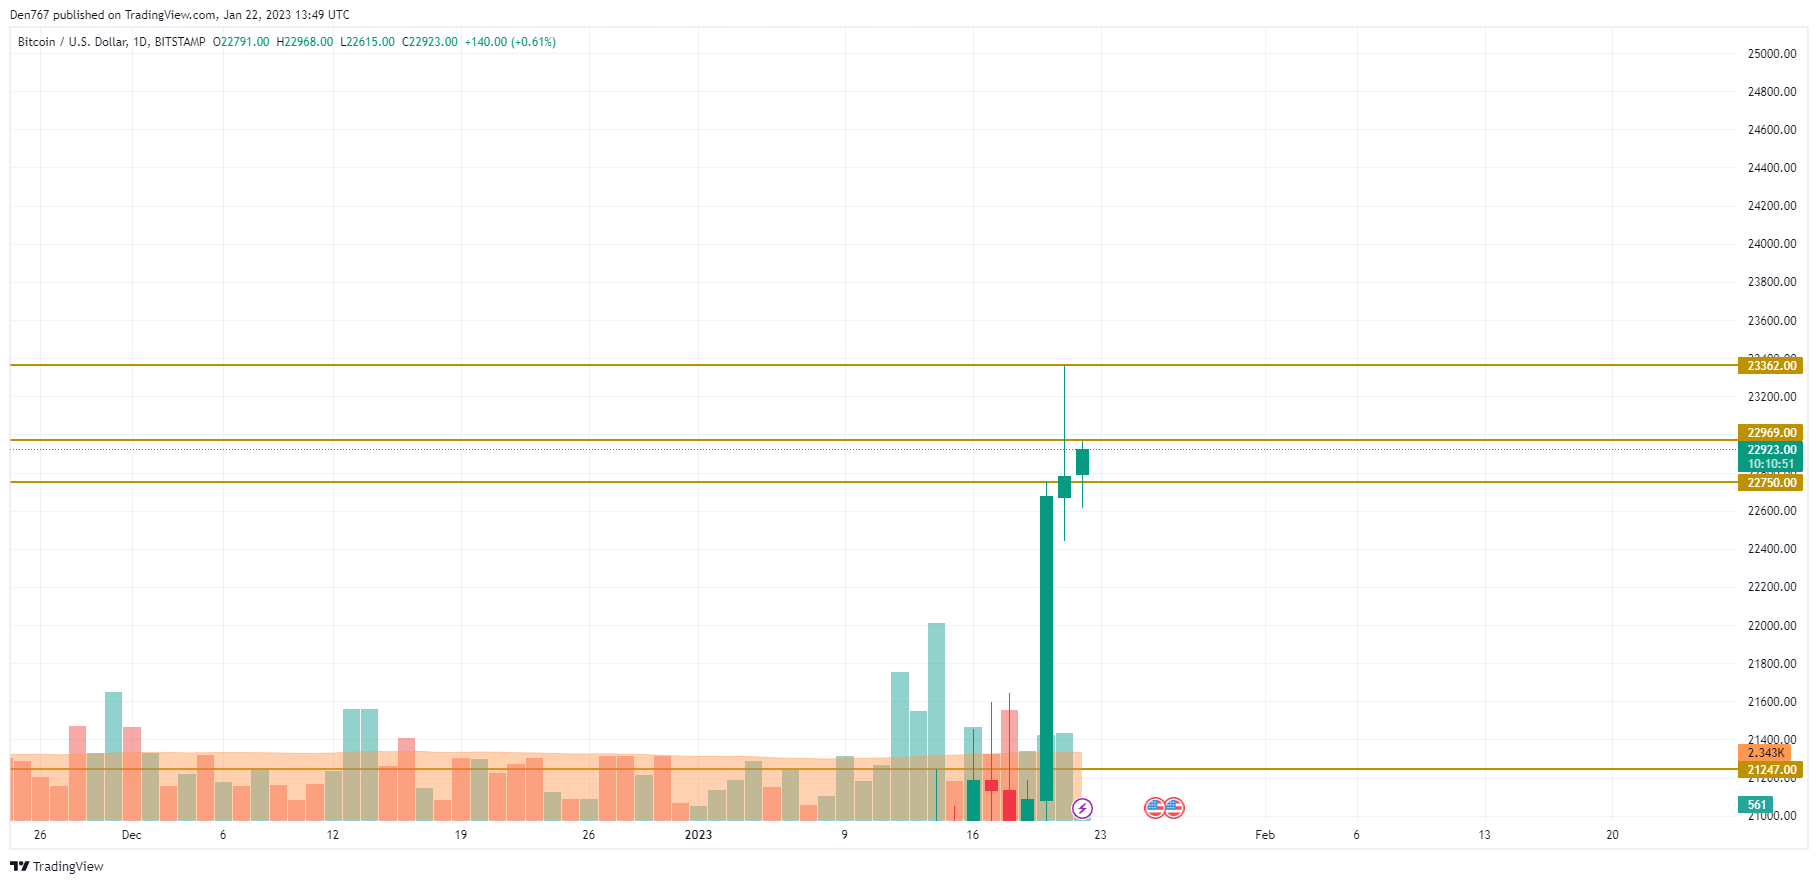
On the bigger time frame, the situation is also positive as the price has bounced back from the recently formed support level of $22,750. If closure happens near the important $23,000 zone, the upward move can continue to $23,362.
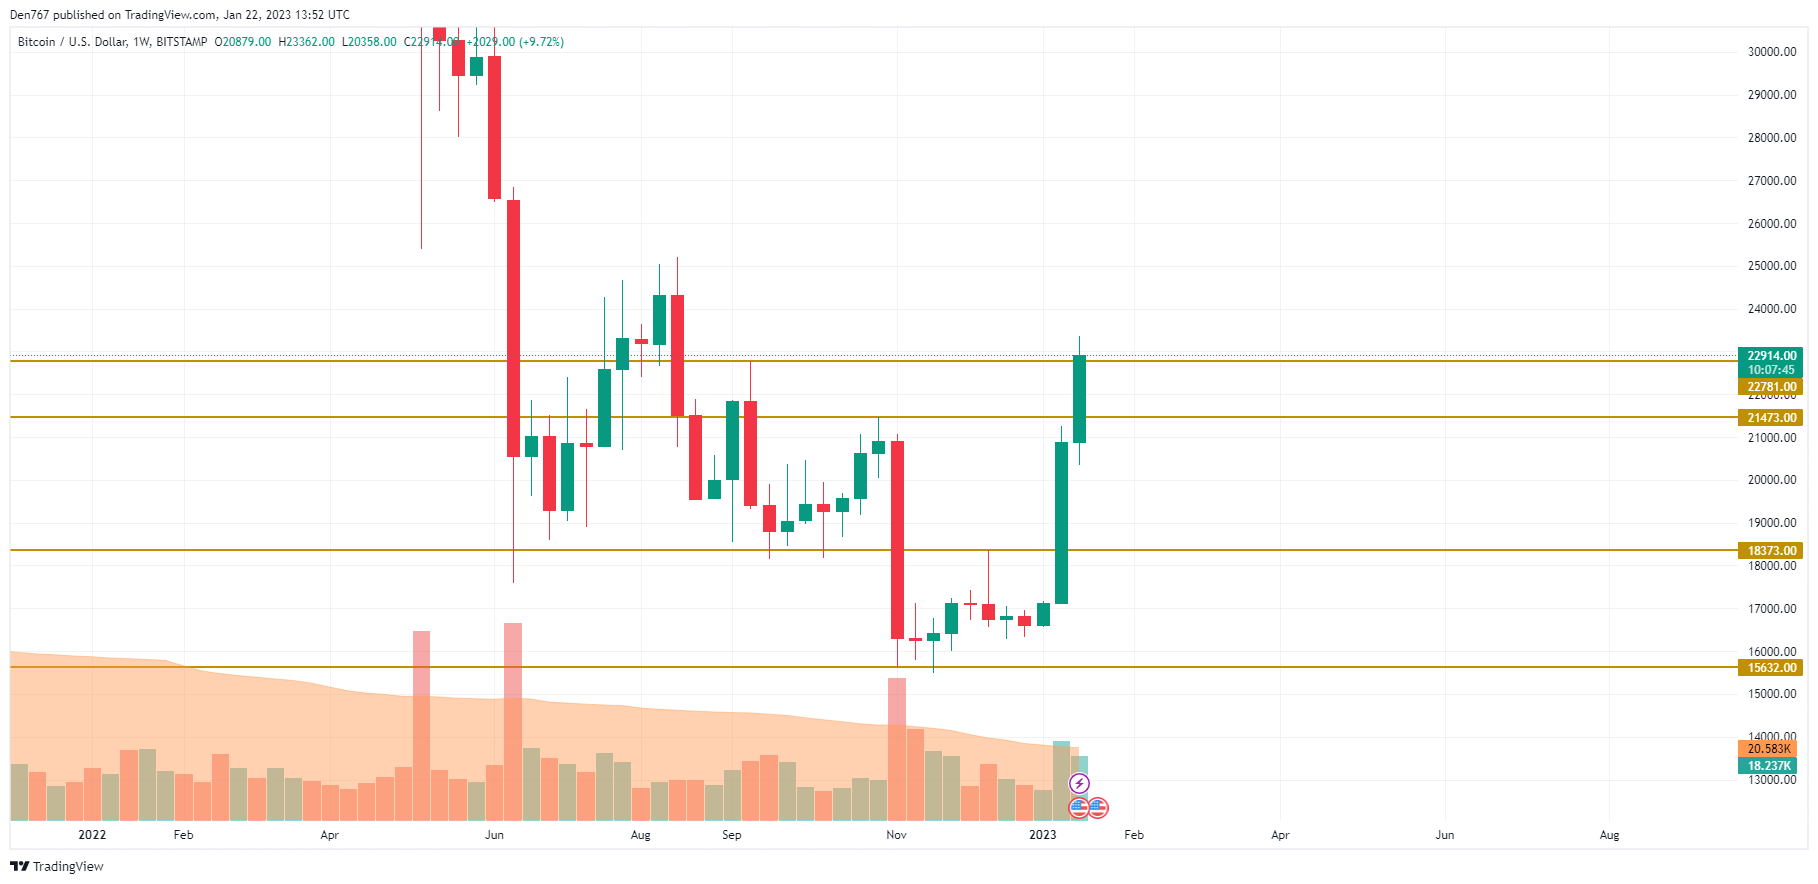
From the midterm point of view, the weekly candle is about to close above the $22,781 mark, which means that Bitcoin (BTC) remains bullish. In this regard, the energy might be enough for a move to the next resistance area of around $25,000.
Bitcoin is trading at $22,912 at press time.


 Bitcoin
  Ethereum
  Tether
  USDC
USDC  TRON
TRON  Dogecoin
  Cardano
  Bitcoin Cash
  Chainlink
  Monero
  LEO Token
  Zcash
Zcash  Stellar
  Litecoin
  Hedera
  Dai
Dai  Cronos
  Tether Gold
  OKB
OKB  Ethereum Classic
  KuCoin
  Gate
Gate  Algorand
  Cosmos Hub
  VeChain
  TrueUSD
  Dash
Dash  Tezos
Tezos  Stacks
  IOTA
IOTA  Basic Attention
  Theta Network
  Decred
  NEO
NEO  Synthetix
  Qtum
Qtum  Ravencoin
  DigiByte
  0x Protocol
  Nano
Nano  Zilliqa
  Siacoin
  Numeraire
  Waves
Waves  Status
  BUSD
BUSD  Pax Dollar
  Enjin Coin
  Ontology
  Hive
Hive  Lisk
Lisk  Steem
Steem  Huobi
Huobi  OMG Network
  NEM
NEM  Bitcoin Gold
  Augur
Augur  Ren
Ren  HUSD
HUSD