Ethereum Price Signals Bullish Breakout, Why Dips Turned Attractive

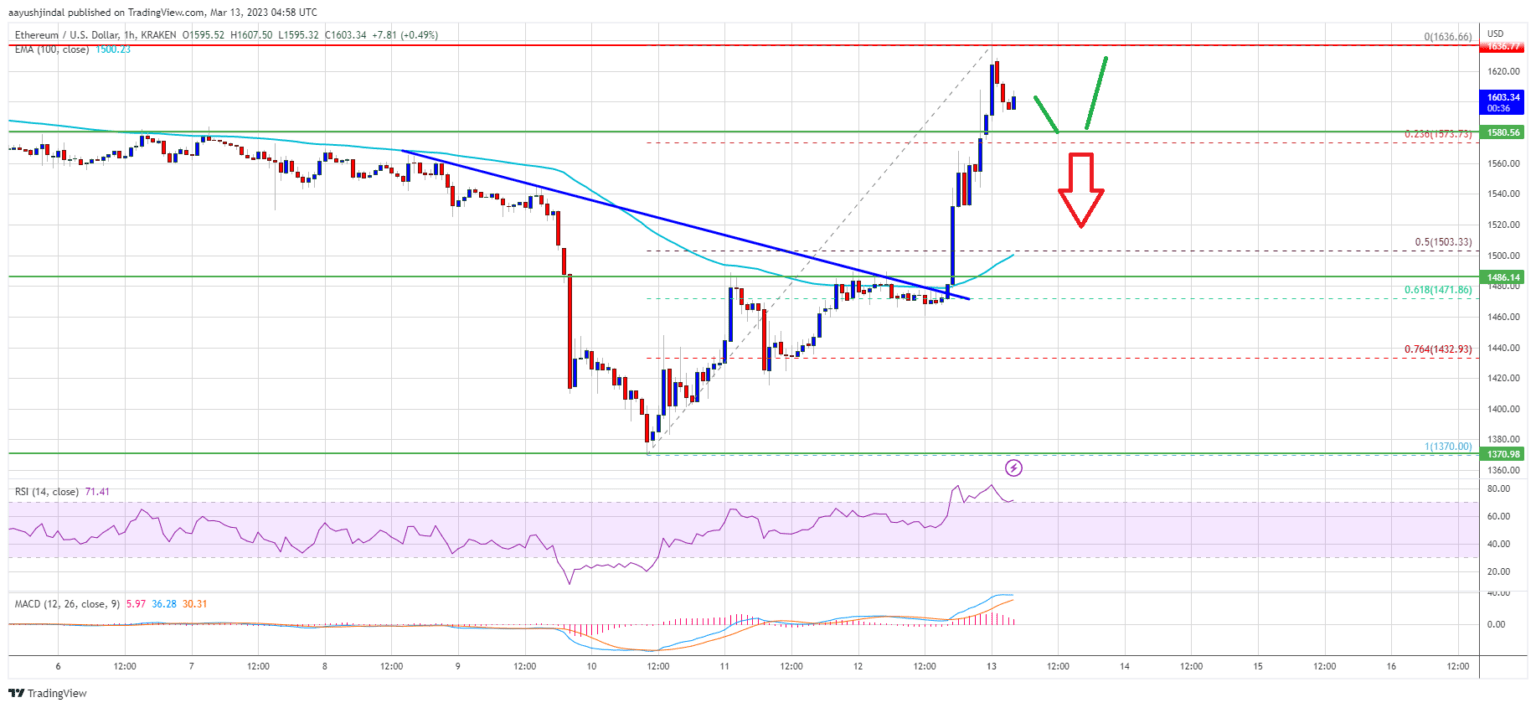
Ethereum price rallied over 10% and broke the $1,600 resistance against the US Dollar. ETH could continue to rise if it stays above the $1,580 support zone.
- Ethereum started a major increase above the $1,565 resistance zone.
- The price is trading above $1,580 and the 100 hourly simple moving average.
- There was a break above a crucial bearish trend line with resistance near $1,480 on the hourly chart of ETH/USD (data feed via Kraken).
- The pair could correct lower, but dips might be limited below the $1,580 support.
Ethereum Price Surges Over 10%
Ethereum price spiked towards the $1,370, where the bulls took a stand. ETH formed a base and started a strong increase above the $1,450 resistance, similar to bitcoin.
There was a clear move above the $1,500 and $1,565 resistance levels. Besides, there was a break above a crucial bearish trend line with resistance near $1,480 on the hourly chart of ETH/USD. Finally, the pair surpassed the $1,600 resistance and traded as high as $1,636.
Ether price is now trading above $1,580 and the 100 hourly simple moving average. It is consolidating gains and trading above the 23.6% Fib retracement level of the upward move from the $1,370 swing low to $1,636 high.
On the upside, the price is facing resistance near the $1,630 zone. The first major resistance is near the $1,680 zone. The next major resistance is near the $1,700 level.

Source: ETHUSD on TradingView.com
The main resistance is still near the $1,740 zone. A close above the $1,740 resistance zone might start a major uptrend. In this case, the price may perhaps rise towards the $1,850 resistance level.
Dips Limited in ETH?
If ethereum fails to clear the $1,630 resistance, it could start a downside correction. An initial support on the downside is near the $1,580 level.
The next major support is near the $1,560 zone. If there is a break below $1,560, the price might drop towards $1,500. It is near the 50% Fib retracement level of the upward move from the $1,370 swing low to $1,636 high. Any more losses might call for a test of the $1,430 level.
Technical Indicators
Hourly MACD – The MACD for ETH/USD is now losing momentum in the bullish zone.
Hourly RSI – The RSI for ETH/USD is now in the overbought zone.
Major Support Level – $1,580
Major Resistance Level – $1,630


 Bitcoin
  Ethereum
  Tether
  USDC
USDC  Dogecoin
  TRON
TRON  Cardano
  Chainlink
  Stellar
  LEO Token
  Bitcoin Cash
  Hedera
  Litecoin
  Monero
  Dai
Dai  Cronos
  OKB
OKB  Ethereum Classic
  Gate
Gate  VeChain
  Cosmos Hub
  Algorand
  KuCoin
  Stacks
  Maker
Maker  Tether Gold
  Zcash
Zcash  Theta Network
  IOTA
IOTA  Tezos
Tezos  TrueUSD
  NEO
NEO  Polygon
  Dash
Dash  Decred
  Synthetix Network
  Zilliqa
  Qtum
Qtum  0x Protocol
  Basic Attention
  Siacoin
  Holo
Holo  Ravencoin
  DigiByte
  Status
  Enjin Coin
  Nano
Nano  Ontology
  Hive
Hive  Waves
Waves  Lisk
Lisk  Pax Dollar
  Numeraire
  NEM
NEM  Steem
Steem  BUSD
BUSD  Huobi
Huobi  OMG Network
  Bitcoin Gold
  Ren
Ren  Bitcoin Diamond
  Augur
Augur  HUSD
HUSD