Watch these Bitcoin price levels next as BTC dips 3% in choppy weekend

Bitcoin (BTC) saw fresh volatility on May 6 as low-liquidity weekend trading tested the mettle of its trading range.

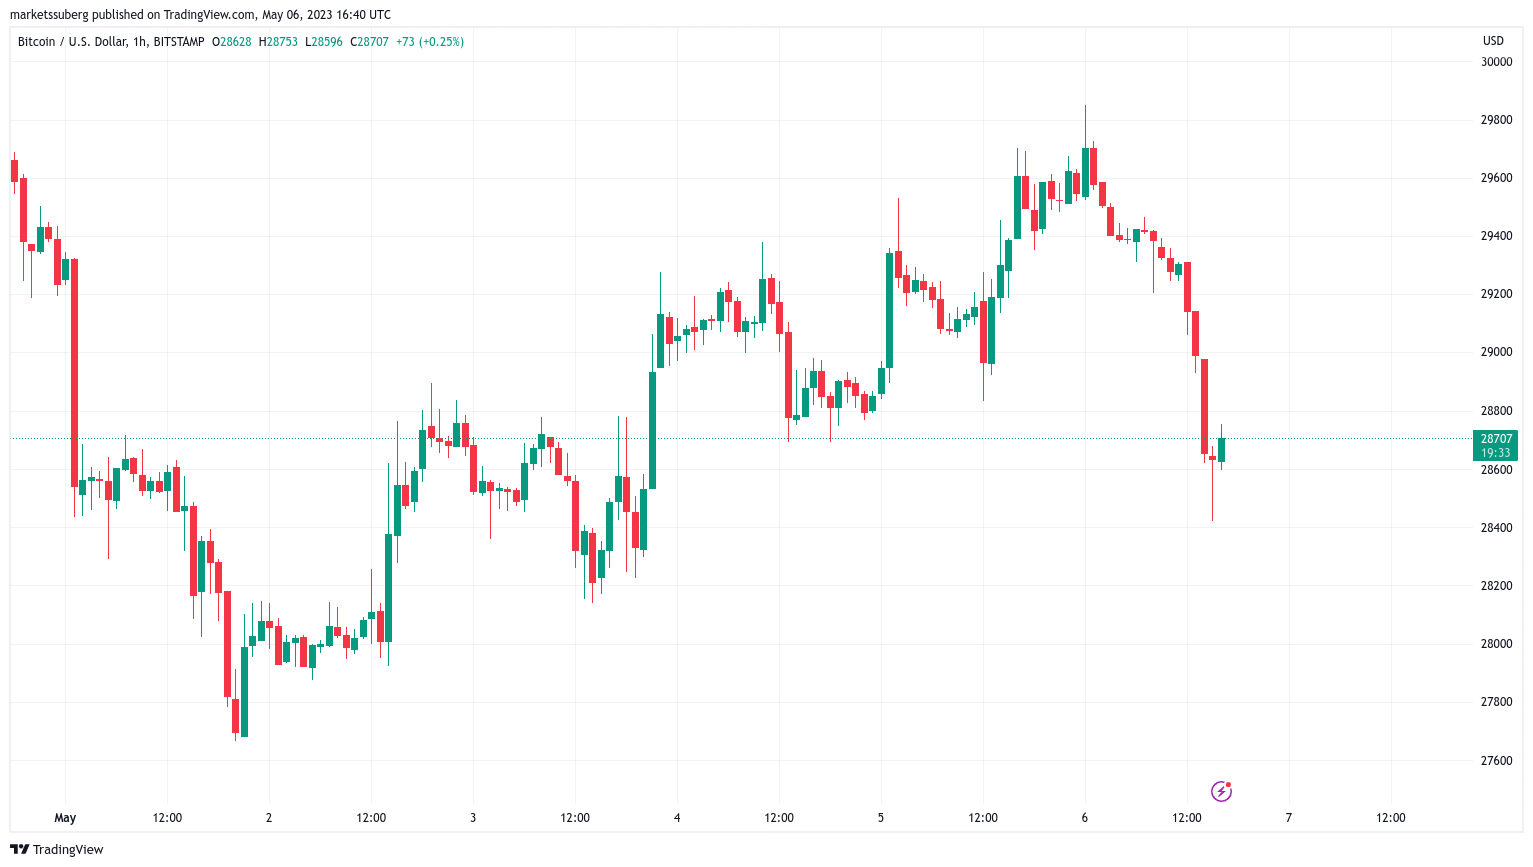
BTC/USD 1-hour candle chart (Bitstamp). Source: TradingView
Bitcoin in limbo despite volatili
Data from Cointelegraph Markets Pro and TradingView showed BTC/USD shedding over $1,000, or 3%, in a matter of hours on the day.
The largest cryptocurrency saw livelier conditions typical of weekend trading while remaining unable to exit a broader corridor in place for many weeks.
Amid a lack of ammuniation to either clear $30,000 resistance or drop toward key trend lines near $25,000, BTC/USD frustrated market participants.
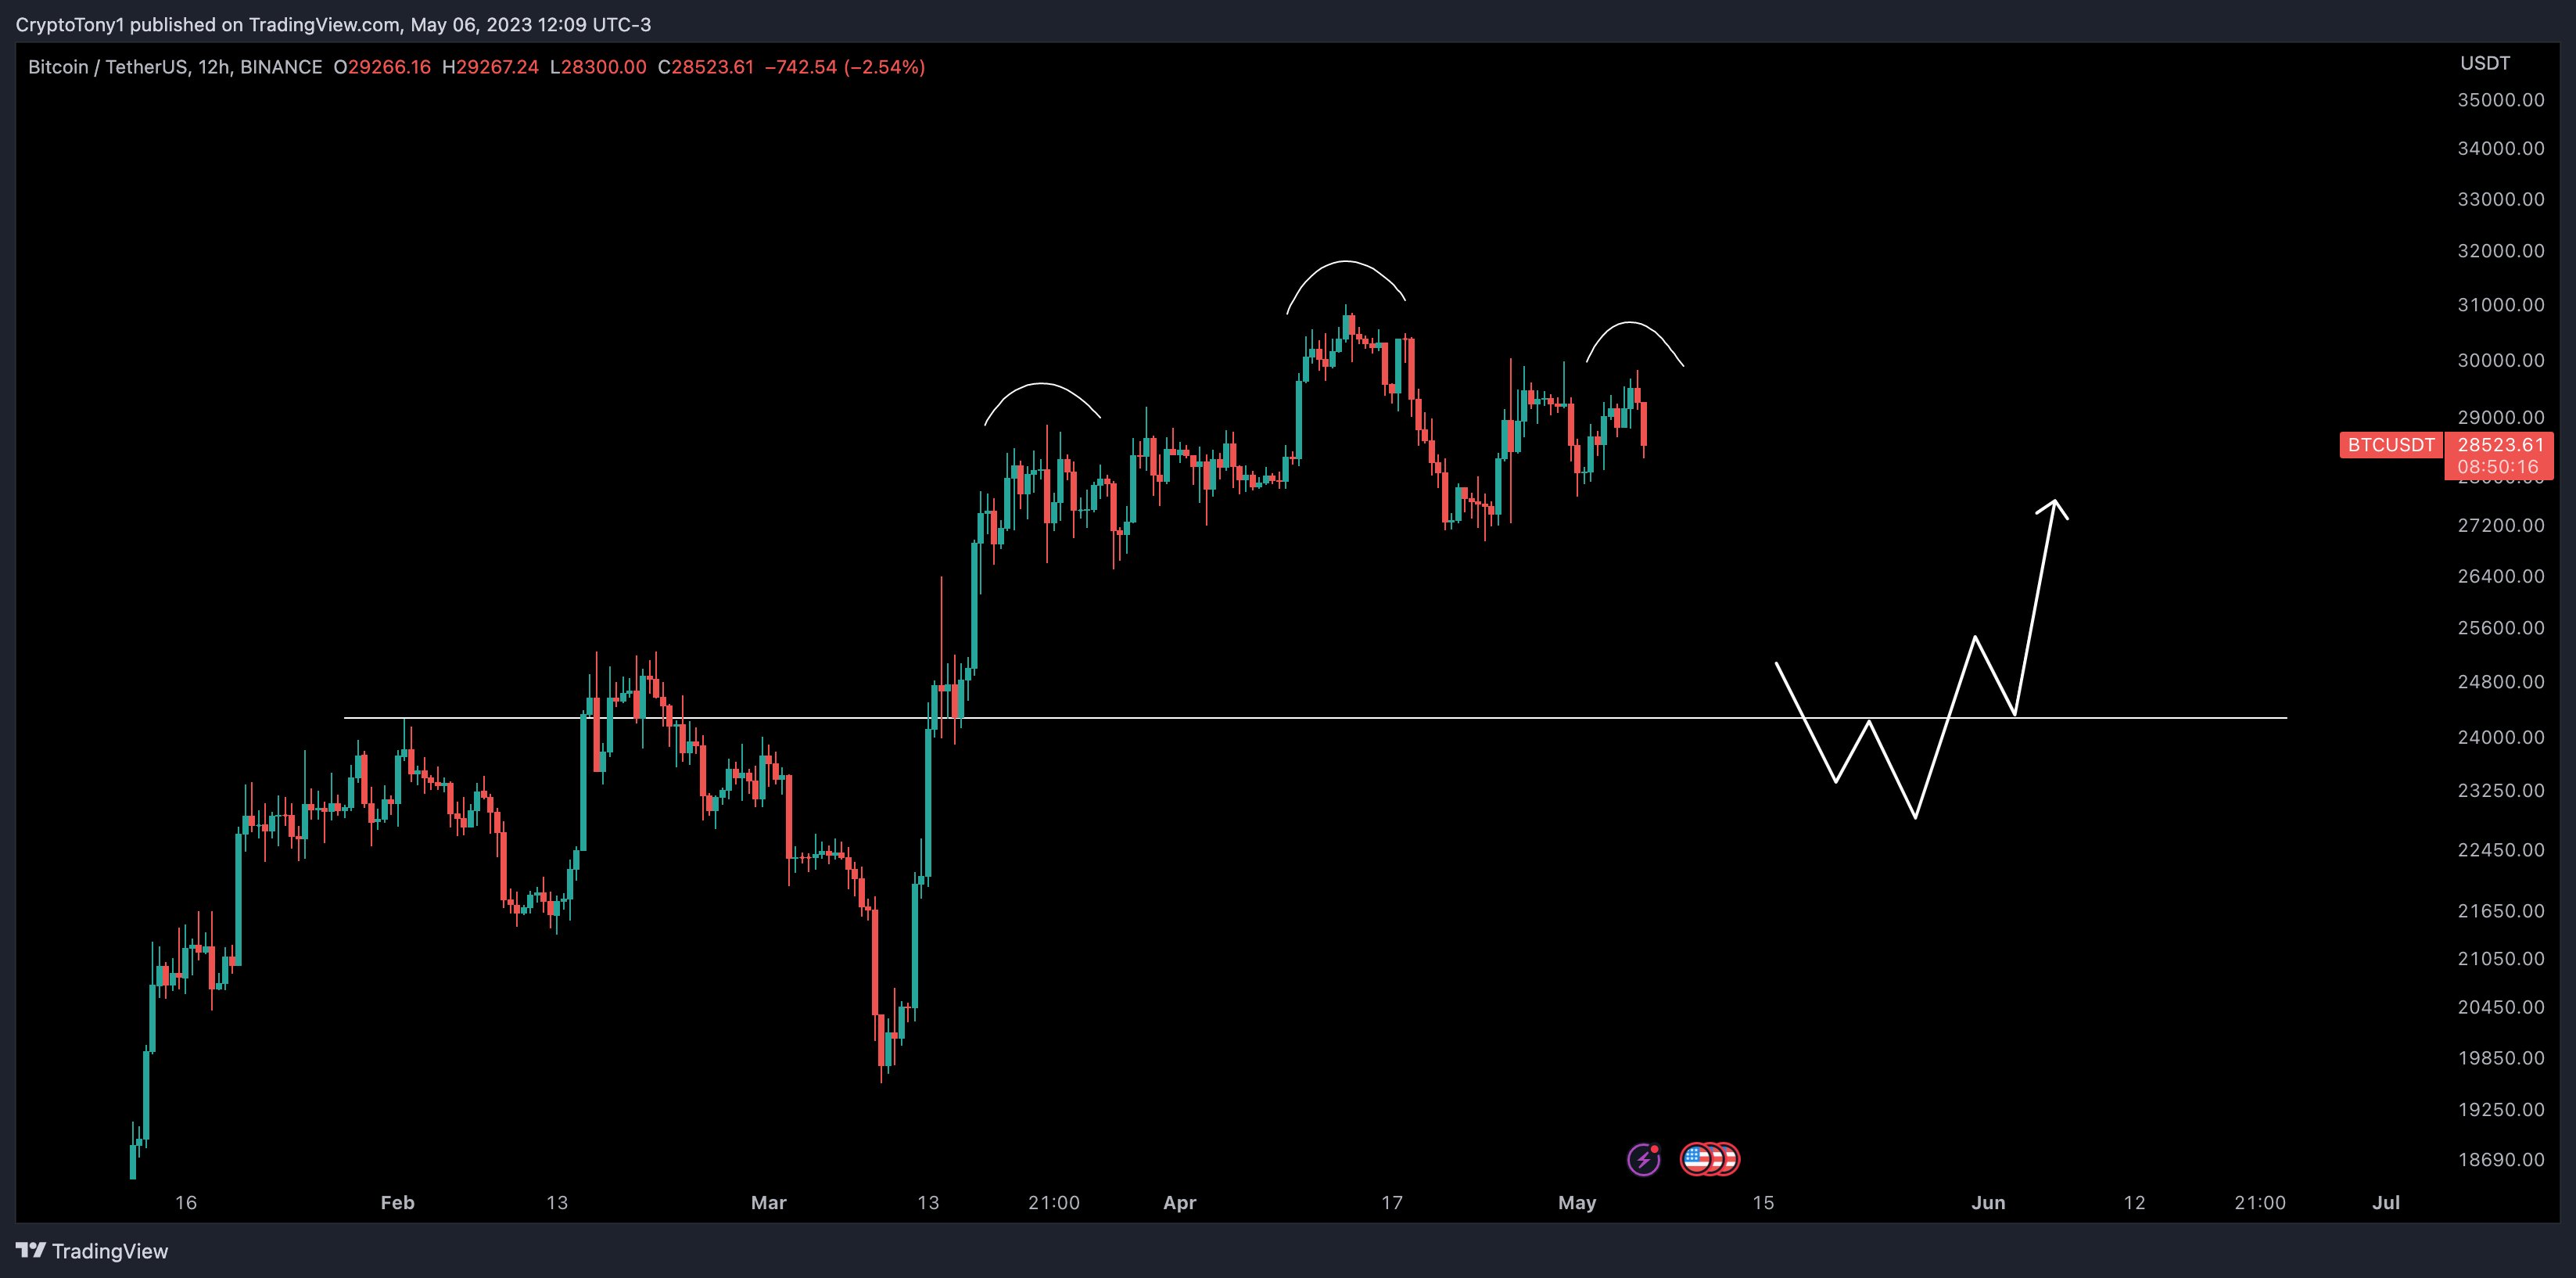
“Bitcoin really is in limbo right now and doesn’t know what to do .. I am back out of a position and just waiting again for one side of this range to break to re enter,” popular trader Crypto Tony told Twitter followers.
An accompanying chart showed potential targets in the event of a bearish breakdown.

BTC/USD annotated chart. Source: Crypto Tony/Twitter
Additional analysis released earlier in the day meanwhile repeated existing predictions of $32,000 coming into play should bullish momentum return.
$BTC / $USD — Update
While the attention is all on #Memecoins i am not surprised that we are literally seeing a stagnated #Bitcoin
The fun will continue sooner or later as it always does, but for now we plan ahead. A move to the high $32,000 would be perfect pic.twitter.com/m9uI3RmDln
— Crypto Tony (@CryptoTony__) May 6, 2023
In separate coverage, fellow trader CryptoBullet described the day’s losses as “nothing special.”
“Final dip before the breakout,” part of commentary argued, with a chart presenting BTC/USD in a narrowing wedge with a decision on exit trajectory due.
#Bitcoin $BTC 4h update
Nothing special about the current dump, just (e) in the making
Final dip before the breakout https://t.co/pFw8HX8jNq pic.twitter.com/ko4Q0nlkwE
— CryptoBullet (@CryptoBullet1) May 6, 2023
BTC price bulls must clear $30,000
As ever, longer timeframes were a cause for more optimistic views.
Related: Bitcoin trader eyes $63K BTC price for new Bollinger Bands ‘breakout’
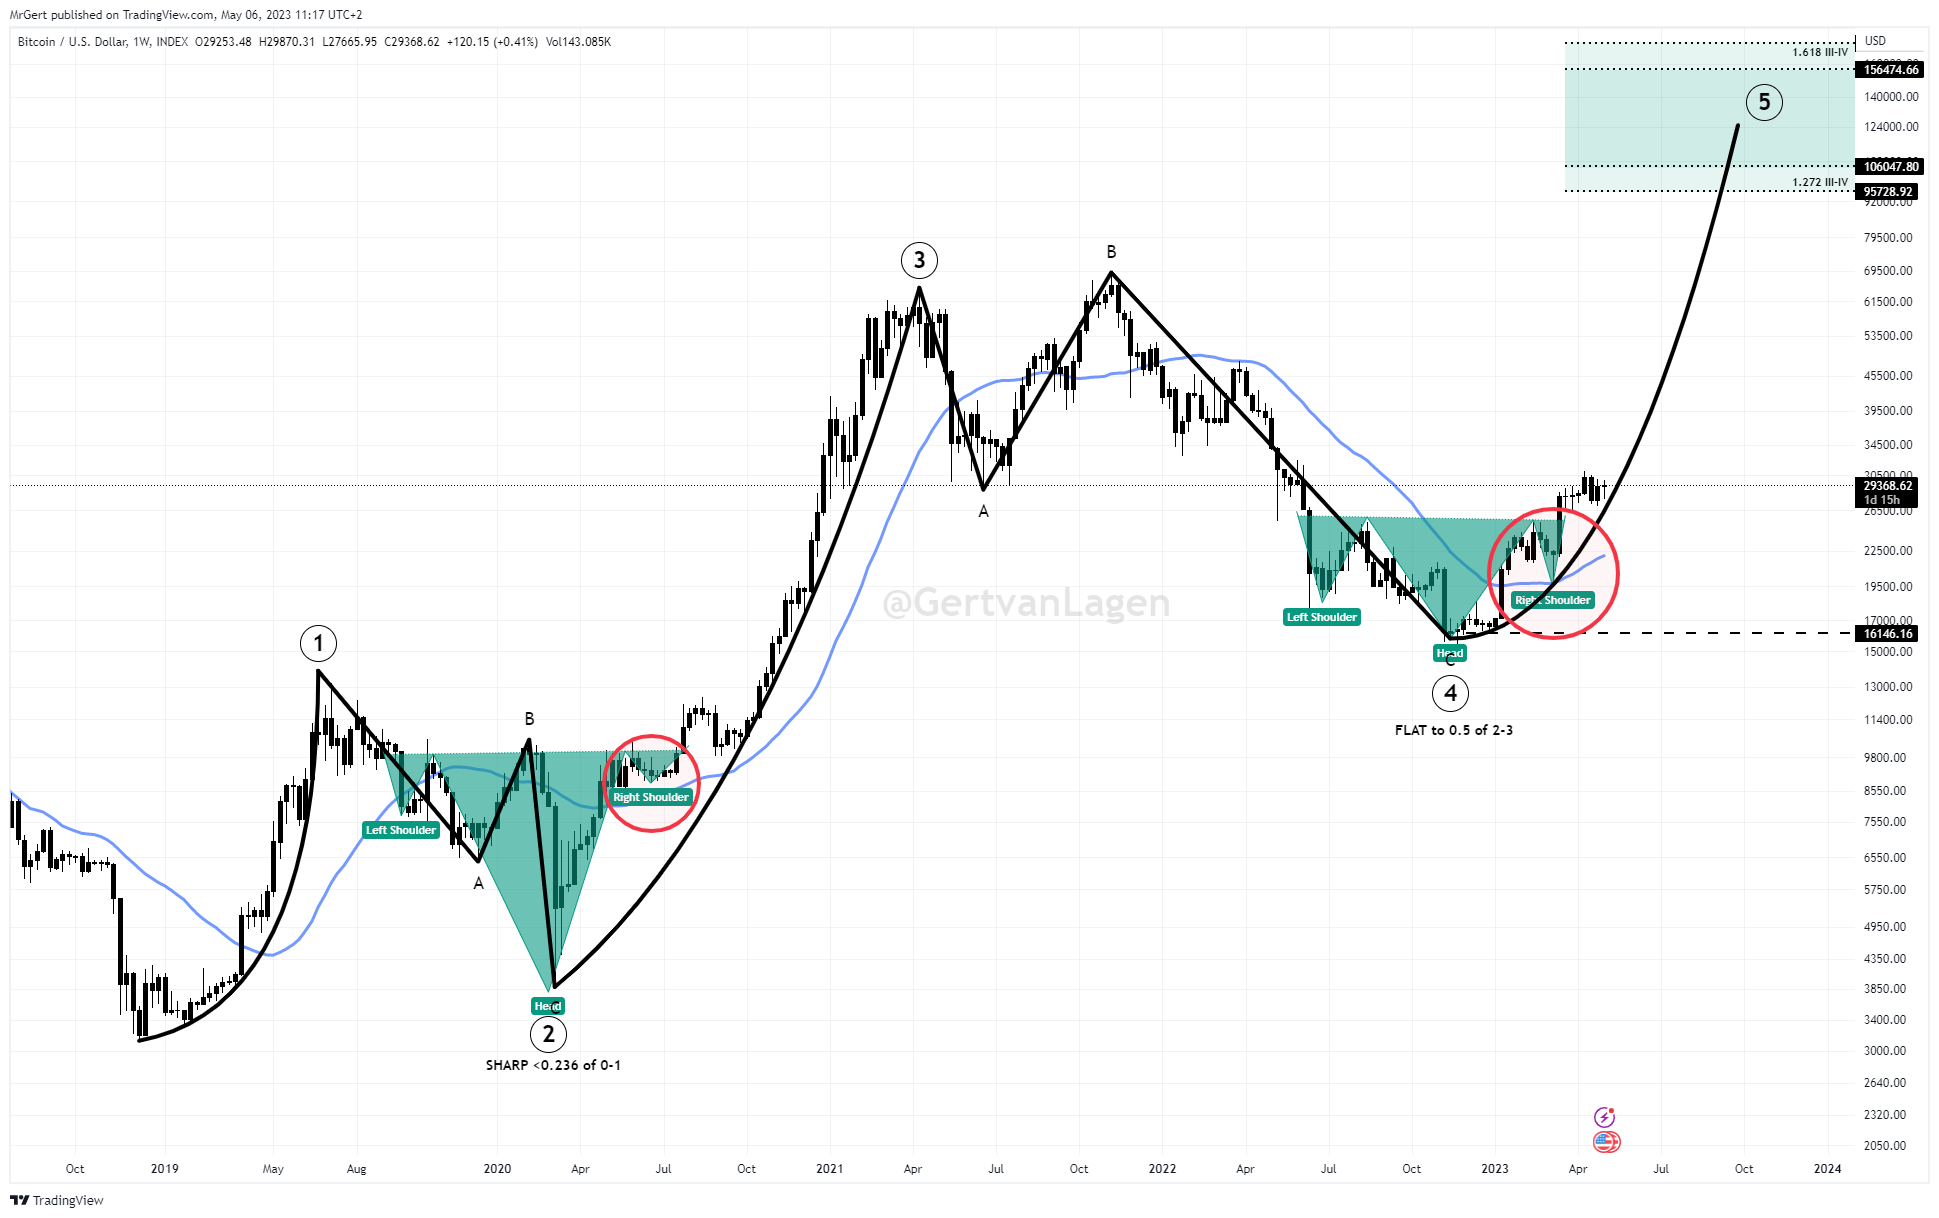
Analyzing the weekly chart, analyst Gert van Lagen flagged the 200-week simple moving average (SMA) as the resistance line to clear next, with Bitcoin possibly completing an equally bullish inverse head and shoulders chart pattern.

BTC/USD annotated chart. Source: Gert van Lagen/Twitter
Trader and investor CryptoAce meanwhile highlighted a large weekly resistance zone for bulls to tackle.
“Stay below and $24k is where price will be trading in some weeks imo,” part of an update on trading activity read on the day.
$BTC
Weekly resistance block $29.7k — $31.5k
Stay below and $24k is where price will be trading in some weeks imoLast week took short from $29.7k & covered $28k
Now looking to short above $29.5k till $31.5k for $24k https://t.co/uewwZLtMzc pic.twitter.com/BVtGahtLr7— Cryptoce (@CryptoAceBTC) May 6, 2023
Magazine: Unstablecoins: Depegging, bank runs and other risks loom
This article does not contain investment advice or recommendations. Every investment and trading move involves risk, and readers should conduct their own research when making a decision.


 Bitcoin
  Ethereum
  Tether
  USDC
USDC  TRON
TRON  Dogecoin
  Cardano
  Bitcoin Cash
  Chainlink
  Monero
  LEO Token
  Zcash
Zcash  Stellar
  Litecoin
  Hedera
  Dai
Dai  Cronos
  Tether Gold
  OKB
OKB  Ethereum Classic
  KuCoin
  Gate
Gate  Algorand
  Cosmos Hub
  VeChain
  Dash
Dash  TrueUSD
  Tezos
Tezos  Stacks
  IOTA
IOTA  Basic Attention
  Theta Network
  Decred
  NEO
NEO  Synthetix
  Qtum
Qtum  Ravencoin
  DigiByte
  0x Protocol
  Nano
Nano  Zilliqa
  Holo
Holo  Siacoin
  Numeraire
  Waves
Waves  Status
  BUSD
BUSD  Enjin Coin
  Pax Dollar
  Ontology
  Hive
Hive  Lisk
Lisk  Steem
Steem  Huobi
Huobi  NEM
NEM  OMG Network
  Bitcoin Gold
  Augur
Augur  Ren
Ren  HUSD
HUSD