Ethereum Attempts to Breach the 100 EMA; Can ETH Succeed?

Ethereum has now become profit and gains. Despite the ups and downs, the ETH price has returned to its previous peaks. This time it has gained tremendous price action from its June 2022 dip value of $883. The market capitalization of ETH has reached $204,925,177,350 and showcases a strong potential to continue moving upwards.
The last thirty days alone have supported a huge gain. This digital economy was worth above $600 billion during its peak in December 2021. The core idea behind ETH is now even stronger; as new developments are released each month, the value of this token is set to move upwards.
ETH token has emerged victorious to some extent as the prices have moved upwards with a high intensity despite the volumes remaining under wraps. Technicals showcase buying sentiment nearing the overbought zones, which could result in some profit booking or consolidation. Check out in which direction the ETH price will move by clicking here.

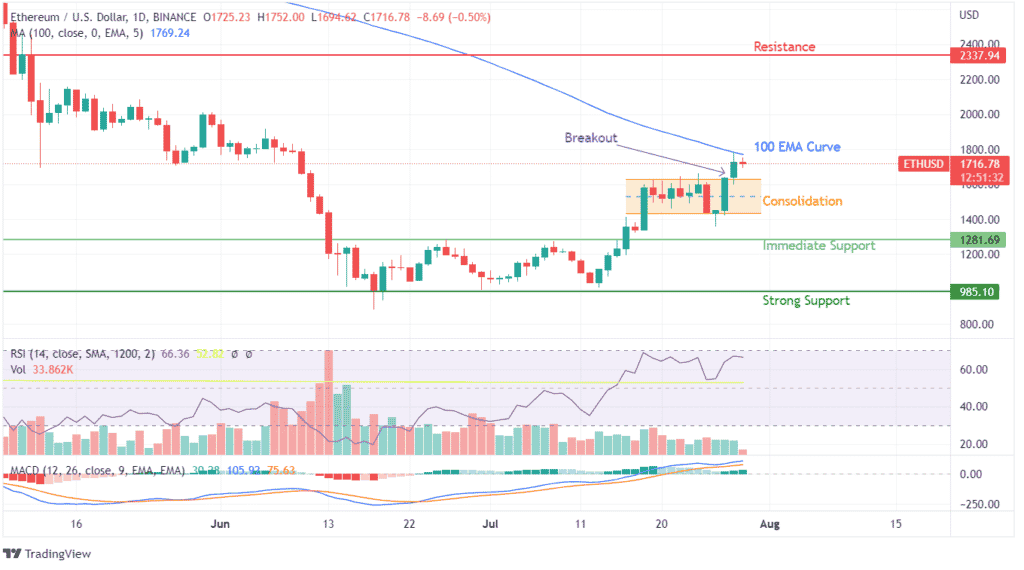
The price movement happened as ETH closed towards its 50 EMA. The immediate response to the trend was rejection, but soon a huge jump took ETH above its 50 EMA curve. A similar trend is being repeated as ETH is now closing on to the 100 EMA curve, which could be a game changer for its price potential in the short term.
Talking about the technicals of Ethereum, RSI is showcasing hibernation by the sellers while buyers dominate the market sentiments. Once again, ETH has marked strong gains with an intensity that makes buyers believe in its capability to breach the 100 EMA curve. MACD indicator for Ethereum has now entered the positive axis with no immediate projections of a bearish crossover.
The immediate support level has moved up to $1281, while a strong support level is active at $985. A consolidation breakout has already occurred on July 28, 2022, marking for-profit booking. Since the technical indicators present evidence of ETH entering an overbought zone, buyers should brace for a real consolidation as buyers and sellers would battle it out for the 100 EMA.

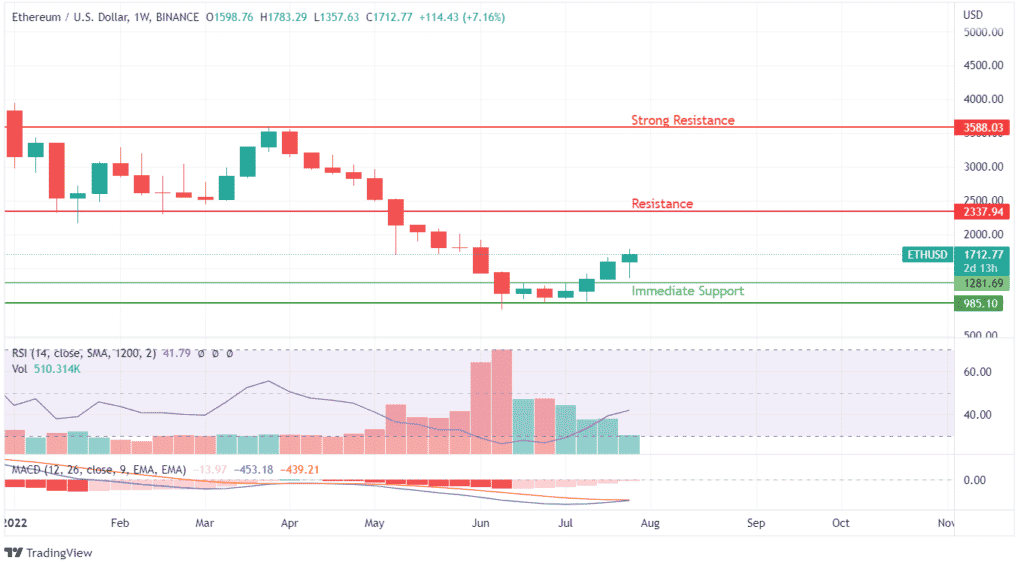
The clarity offered by weekly charts shows a strong pullback from the immediate resistance level despite facing seller-based resistances for the last three weeks. ETH is short of 36% from its immediate resistance and 108% from its strong resistance of $3588. MACD on this timeline indicates a bullish crossover is soon to happen.
While the RSI and the volumetric indicators mark the growth of buying sentiment even on a larger time frame, breaching the May 2022 peak should be its objective in the immediate reversal swing. Ethereum creates the perfect setup for making tremendous gains in the short term.


 Bitcoin
  Ethereum
  Tether
  Dogecoin
  USDC
USDC  Cardano
  TRON
TRON  Chainlink
  Stellar
  Hedera
  Bitcoin Cash
  LEO Token
  Litecoin
  Cronos
  Ethereum Classic
  Monero
  Dai
Dai  Algorand
  OKB
OKB  Cosmos Hub
  Stacks
  Gate
Gate  Theta Network
  Tezos
Tezos  Maker
Maker  KuCoin
  IOTA
IOTA  NEO
NEO  Polygon
  Zcash
Zcash  Tether Gold
  Synthetix Network
  TrueUSD
  Dash
Dash  0x Protocol
  Zilliqa
  Holo
Holo  Enjin Coin
  Basic Attention
  Siacoin
  Qtum
Qtum  Ravencoin
  Hive
Hive  Bitcoin Gold
  NEM
NEM  Decred
  DigiByte
  Ontology
  Huobi
Huobi  Nano
Nano  Waves
Waves  Status
  Lisk
Lisk  Steem
Steem  Numeraire
  Pax Dollar
  BUSD
BUSD  OMG Network
  Bitcoin Diamond