ETH Technical Analysis: Failed Bull Cycle Consolidates in Bear Channel

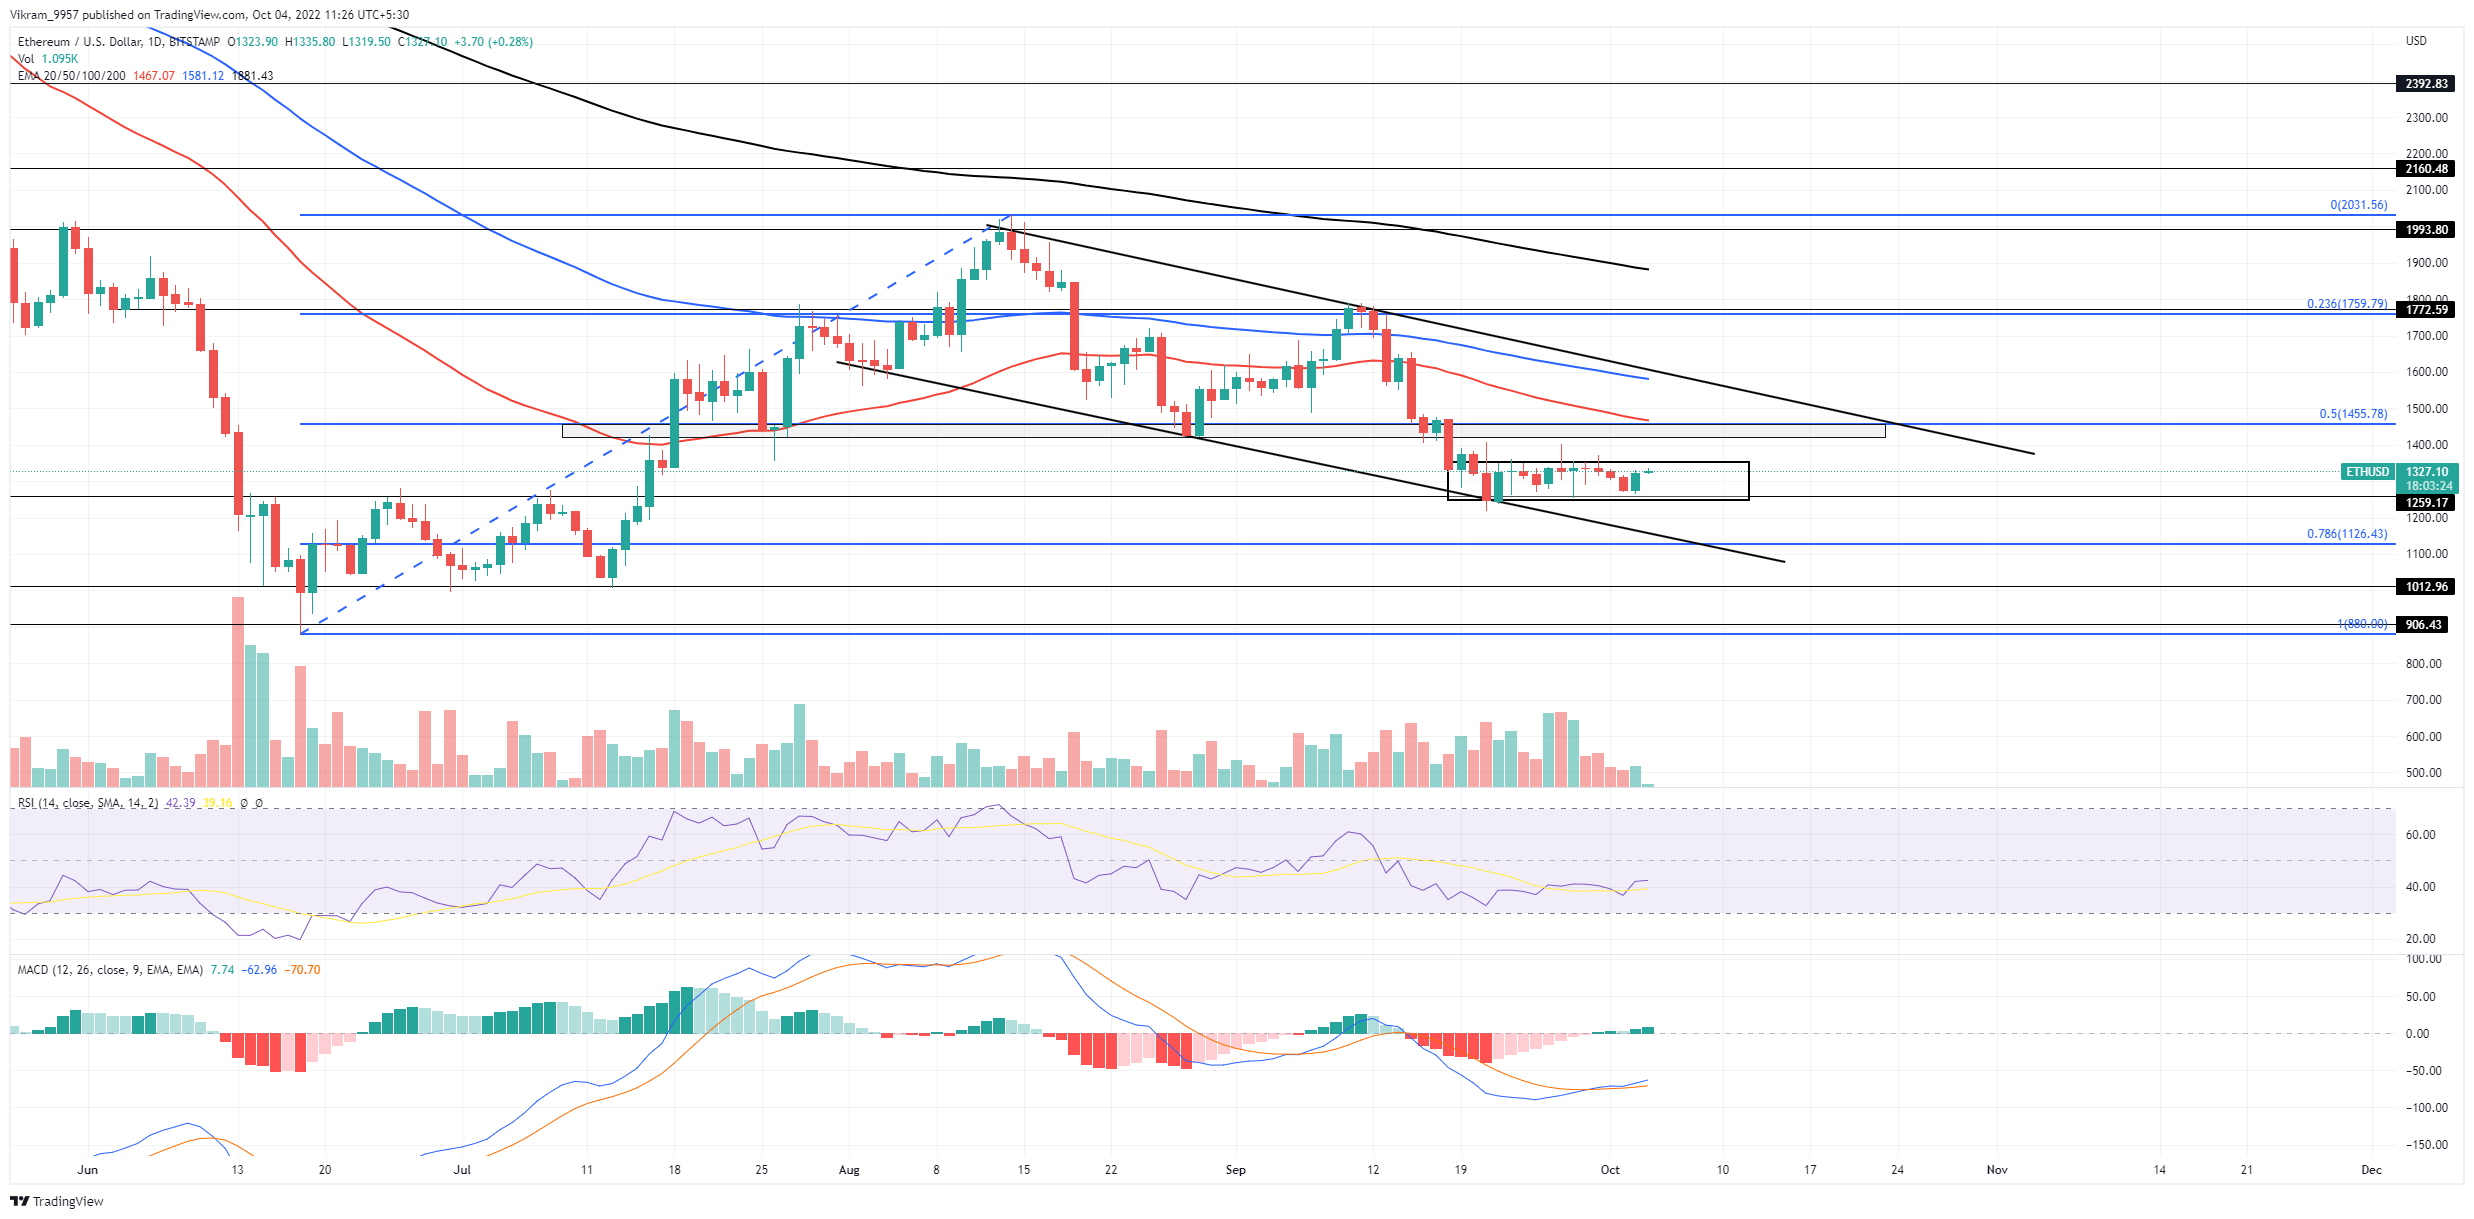
The ETH technical analysis displays a bullish failure to start an uptrend within the falling channel leading to consolidation at the $1250 support level. The ETH price action highlights a falling channel in the daily chart leading to the $1500 support level fallout coinciding with the 50% Fibonacci level. Currently, the price action displays a consolidation face at the $1250 base with multiple higher price rejection candles near the overhead resistance of $1365. However, the recent 3.6% jump in the Ethereum market value leading to a bullish candle with the spike in trading volume teases a bullish breakout.
Key Points:
- The Ethereum price action shows higher price rejection from the 50-day EMA.
- The increase in buying pressure teases a bullish breakout.
- The intraday trading volume in Ethereum is $9.624 Billion.

Source-Tradingview
ETH Technical Analysis
The ETH price action displays a long coming declining trend Leading to a falling channel pattern. The bearish pattern accounts for a price drop of 37%, leading to the fallout of the $1500 mark. The recent bull cycle fails to gain momentum from the support trendline leading to a consolidation phase at $1250. Furthermore, the higher price rejection candles near $1365 project a high supply pressure above the consolidation range. Currently, the price action displays a 1.26 % jump as a follow-through of the 3.67% bullish candle formed yesterday. Moreover, the intraday trading volume spike supports the bullish reversal candle. Hence, the gradually increasing momentum of the bull cycle increases the bullish breakout possibility. The breakout rally can result in a price jump to the 50% Fibonacci level at $1460 to retest the bearish breakout. On a bearish note, if ETH prices reverse within the range, the increased selling will endanger the bullish dominance at $1250.
Technical Indicator
The reversing RSI slope in the nearly overbought crosses the 14-day SMA in an attempt to reach the Halfway line. This reflects an increase in the underlying bullish sentiments teasing a breakout entry shortly. Additionally, the increasing bullish gap between the MACD and signal lines after the recent bullish crossover reflects an increase in buying pressure. Therefore, the technical indicators show growth in bullish demand for Ethereum. As a result, the ETH technical analysis forecasts a bullish breakout of $1365 to challenge the 50% Fibonacci level at $1460. Hence, the sideline traders can find multiple buying opportunities at the current market price. Resistance levels- $1365 and $1460 Support levels- $1250 and $1133


 Bitcoin
  Ethereum
  Tether
  USDC
USDC  TRON
TRON  Dogecoin
  Cardano
  Bitcoin Cash
  Monero
  Chainlink
  LEO Token
  Stellar
  Zcash
Zcash  Litecoin
  Hedera
  Dai
Dai  Cronos
  Tether Gold
  OKB
OKB  Ethereum Classic
  KuCoin
  Cosmos Hub
  Gate
Gate  Algorand
  VeChain
  Stacks
  Tezos
Tezos  TrueUSD
  Dash
Dash  IOTA
IOTA  Theta Network
  Basic Attention
  Decred
  NEO
NEO  Synthetix
  Qtum
Qtum  Ravencoin
  0x Protocol
  Zilliqa
  DigiByte
  Nano
Nano  Holo
Holo  Siacoin
  Numeraire
  Waves
Waves  Ontology
  Status
  Enjin Coin
  BUSD
BUSD  Hive
Hive  Pax Dollar
  Lisk
Lisk  Steem
Steem  Huobi
Huobi  OMG Network
  NEM
NEM  Bitcoin Gold
  Augur
Augur  Bitcoin Diamond