Biggest mining difficulty spike in 14 months — 5 things to know in Bitcoin this week

Bitcoin (BTC) begins a new week still under $20,000 — one which promises to give traders the excitement they have been looking for.
After another very similar weekly close, BTC/USD is still waiting for the breakout from its multi-week trading range.
The move has been long in the making, but so far, the market has lacked the catalyst to make it happen — support and resistance zones have remained unchallenged.
This week, that might all change — the list of economic data prints due in the coming days is impressive, while geopolitical instability is gathering momentum in Europe as the conflict between Russia and Ukraine escalates.
At the same time, Bitcoin is due to show its bear market intentions as the time nears where, historically, macro price bottoms are formed.
A silver lining for bulls, meanwhile, comes from internal sources, with network fundamentals due to make a giant leap higher on the first Wall Street trading day of the week.
With so much to take in, Cointelegraph takes a look at the key issues to keep in mind when planning your Bitcoin trading strategy in the coming week.
Volatility pointers say rare price action due
The weekend was plain sailing for crypto market participants, data from Cointelegraph Markets Pro and TradingView shows.
Despite the added potential for fakeouts thanks to reduced liquidity, the “out-of-hours” status quo remained similar to that of previous days — limited movement within a familiar trading range.
The weekly candle close, coming in at just above $19,400, was also no surprise, although Bitcoin’s highest since mid-September.
On one-week timeframes, BTC/USD thus continued to form a cluster of candles in which the market hardly moved up or down at all — a classic sign that volatility will result.

BTC/USD 1-week candle chart (Bitstamp). Source: TradingView
That breakout event has already been forecast on lower timeframes, these coming true on Friday as United States jobs data sparked a brief sell-off, which cost bulls the $20,000 mark.
Now, analysts are looking for a repeat performance over more significant periods.
“Very unusual to see Bitcoin squeezed at historical low volatility levels on rising volume,” trader and entrepreneur, Jordan Lindsey, told Twitter followers as the week ended.
“A big move up or down is incoming.”
Lindsey referred to a narrowing of Bitcoin’s trading range coming in tandem with trade volume rising — the latter a key component of sustained breakouts.
That thesis is currently being supported by the Bitcoin historical volatility index (BVOL), a dedicated indicator for tracking volatility within its historical context.
Currently, BVOL is at lows seen only a handful of times over Bitcoin’s existence. A notable comparison is October 2018, just two months before the previous cycle’s bear market bottom of $3,100.
“It has been below 36 level 2 times in the past and after which we saw a very big movement in market,” trading account Crypto Vikings commented.
“Currently it’s below 36 level again and it indicates a very big movement is coming soon this month or most probably in november.”
William Clemente, co-founder of digital asset research and trading firm Reflexivity Research, described the BVOL data as “worth noting.”
As such, any violent exit of the range could equally be down as well as up.
Fellow account Livecoin nonetheless noted that BTC/USD has a historical habit of consolidating longer than the market wishes for when volatility is so low.
“Bitcoin hit levels of low volatility not seen in two years,” the trader and investor told Twitter followers on Oct. 9.
“While it’s reasonable to expect a large move now more than ever, It’s also important to note that there were two periods in the past when Bitcoin spent more than 40 days consolidating after hitting these levels.”
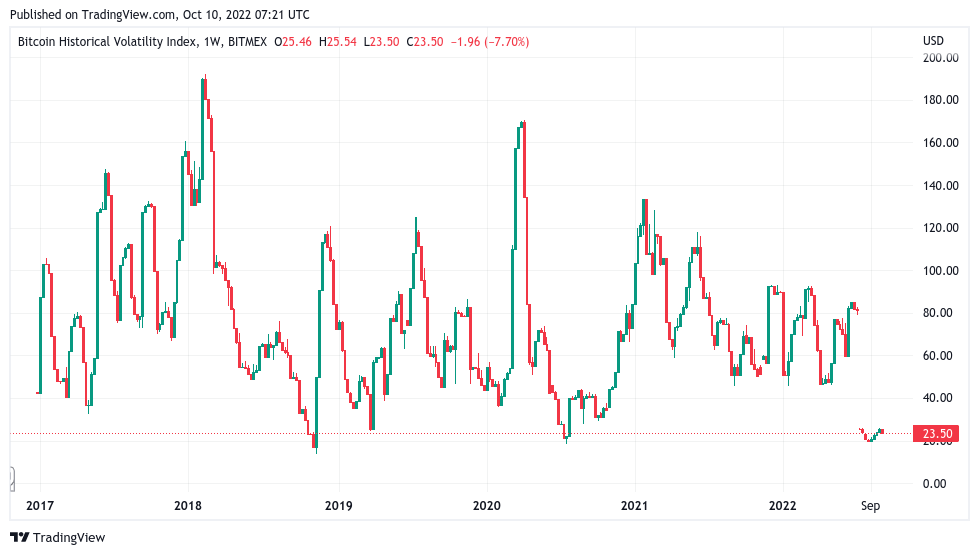
Bitcoin historical volatility index (BVOL) 1-week candle chart. Source: TradingView
In the meantime, however, an eerie calm is perhaps the best description of the atmosphere on Bitcoin.
As summarized by popular trader Matthew Hyland on the day, “Does this market have a pulse?”
September CPI inbound in hectic macro week
Turning to the wider economy, there are more than enough potential BTC price triggers in the making this week.
Economic data releases will come thick and fast from Oct. 12 onward, and with tensions reaching new levels in the Russia-Ukraine war, shocks to commodities markets remain as a curveball.
“This upcoming week is gonna be a fun one: PPI, FOMC minutes, CPI, Initial jobless claims, and retail sales,” Clemente summarized.
Of particular interest, he added, was the U.S. Consumer Price Index (CPI) print for September, due on Oct. 13, which will form a major reference point for the Federal Reserve as it approaches a fresh interest rate hike next month.
While the direction of CPI inflation based on prior prints is likely less of a mystery, each print tends to produce unusual market volatility characterized by “fakeouts” both up and down.
Should this month repeat the trend, speculative trades both long and short could wind up liquidated en masse.
“Expecting serious volatility to jump in with CPI and PPI,” Van de Poppe confirmed in part of a fresh Twitter post on the topic.
“Be ready!”
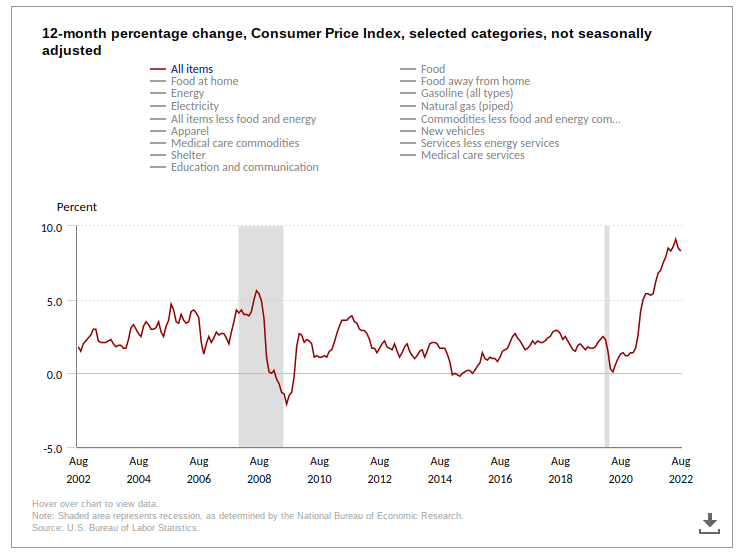
U.S. Consumer Price Index (CPI) chart (screenshot). Source: U.S. Bureau of Labor Statistics
Outside the U.S., meanwhile, Europe is also in the spotlight with events in the Russia-Ukraine war reaching a new magnitude in recent days.
Any sudden developments, especially those involving fuel, have the potential to spark additional upset in traditional markets to which crypto is still correlated.
Difficulty prepares biggest uptick since August 2021
Internal developments in Bitcoin could form the basis for a surge in confidence as the week begins.
According to current estimates, Bitcoin’s mining difficulty is due to add a giant 13% on Oct. 10 — its biggest since August 2021 and easily enough to take it to new all-time highs.
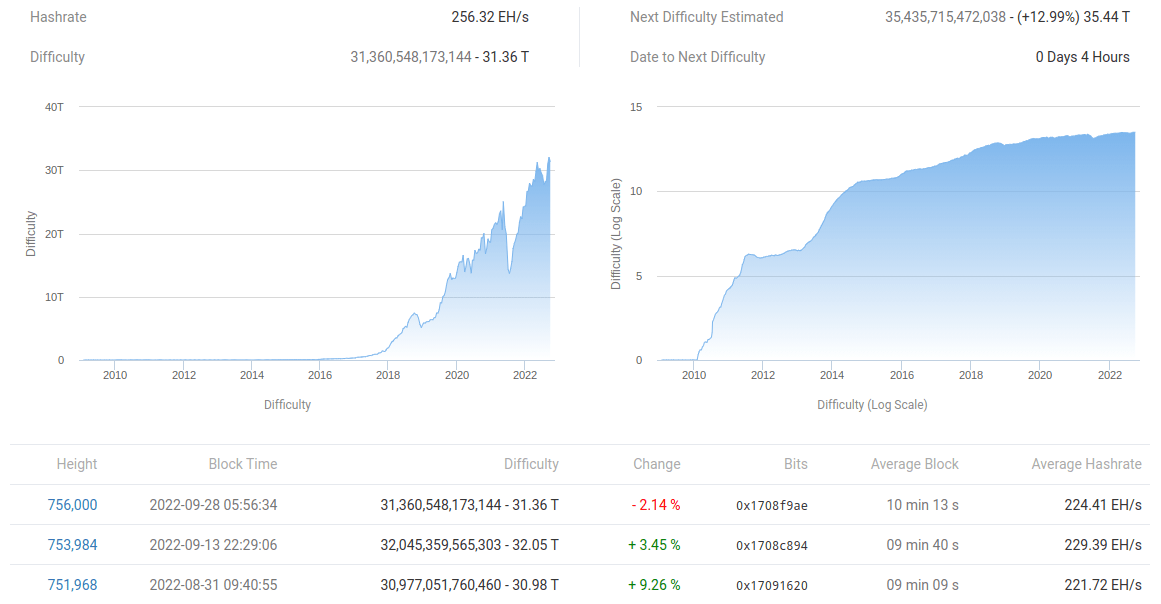
Bitcoin network fundamentals overview (screenshot). Source: BTC.com
The numbers make for surprising reading. Such an increase suggests that miner competition is increasing in line with increasing network participation — yet BTC price action is still near two-year lows.
Miners will already have extremely slim profit margins, with production cost for many likely very near current spot price.
Increasing difficulty and thus financial commitments therefore should squeeze profitability further, raising the risk of miner capitulations.
“Bitcoin miners just won’t stop,” analyst Dylan LeClair wrote about the difficulty estimate last week.
Forecasting where miners could start to run into trouble, meanwhile, on-chain analytics firm Glassnode placed significance on the area around $18,000 thanks to the latest modelling techniques.
“Similar to the Difficulty Regression Model, the price range between $17k and $18k has confluence as being an area that induced miner stress in June, and aligns with numerous cost of production estimates,” it wrote in the latest edition of its weekly newsletter, “The Week On-Chain.”
Should a price drop occur, however, researcher Checkmate nonetheless argued that it is “extremely unlikely” miners would sell their entire inventory, currently worth just under 80,000 BTC.
“This risk could manifest as a second stage miner capitulation, with around 78.4k BTC still held in miner treasuries. It is extremely unlikely this full amount would be distributed, however provides an upper bound gauge on the potential risks at hand,” he concluded.
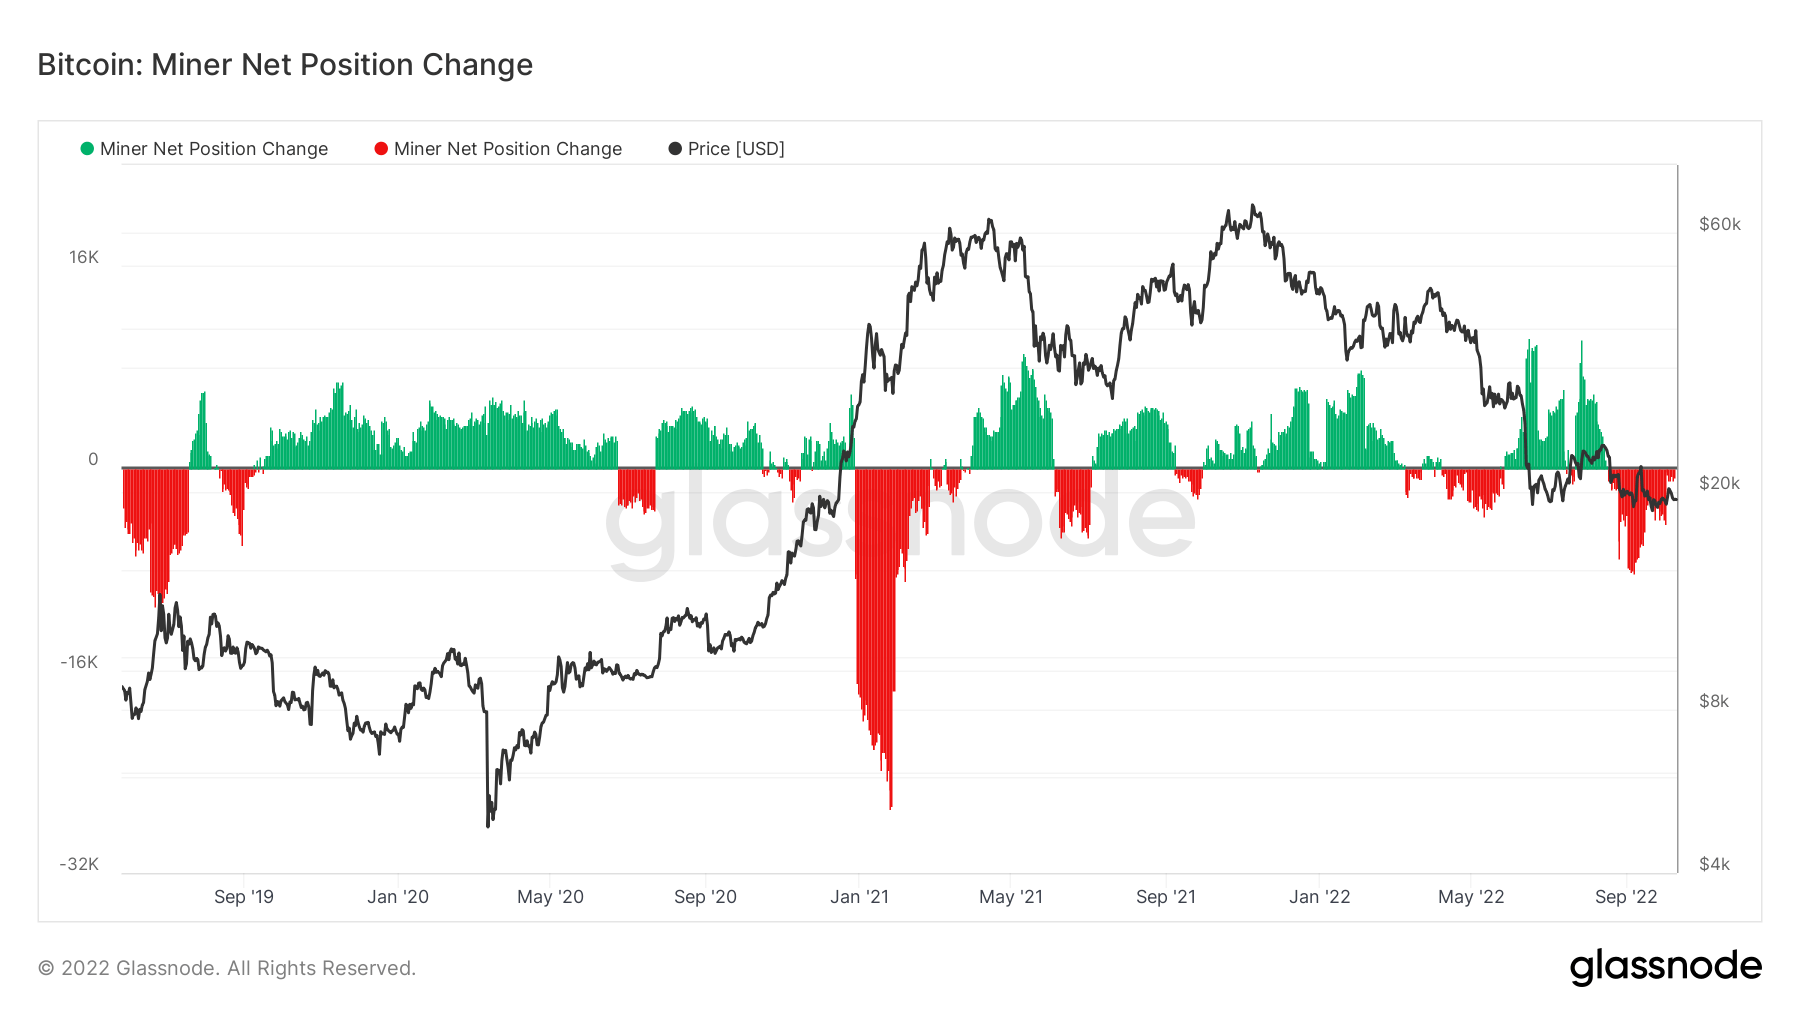
Bitcoin miner net position change chart. Source: Glassnode
Time for a BTC price bottom?
Back to eyeing when BTC/USD could bottom in this bear market, Charles Edwards, CEO of asset manager Capriole, looked to cycles gone by.
In addition to Clemente this weekend, Edwards noted that in both 2018 and 2014, Bitcoin put in a macro bottom within a set period following its prior new all-time high.
The time for history to repeat itself is therefore here, and is only three months long.
“We are in the 90 day window where the last 2 Bitcoin cycles bottomed,” he confirmed, referencing Clemente’s chart comparing distances between Bitcoin all-time highs and subsequent macro lows.
The low could still be far off in terms of price, however. At $19,400, BTC/USD is 71% below its last peak — less by comparison than in 2018.
Even June’s low of $17,600 represents a 74.5% drawdown — not enough to match prior cycles.
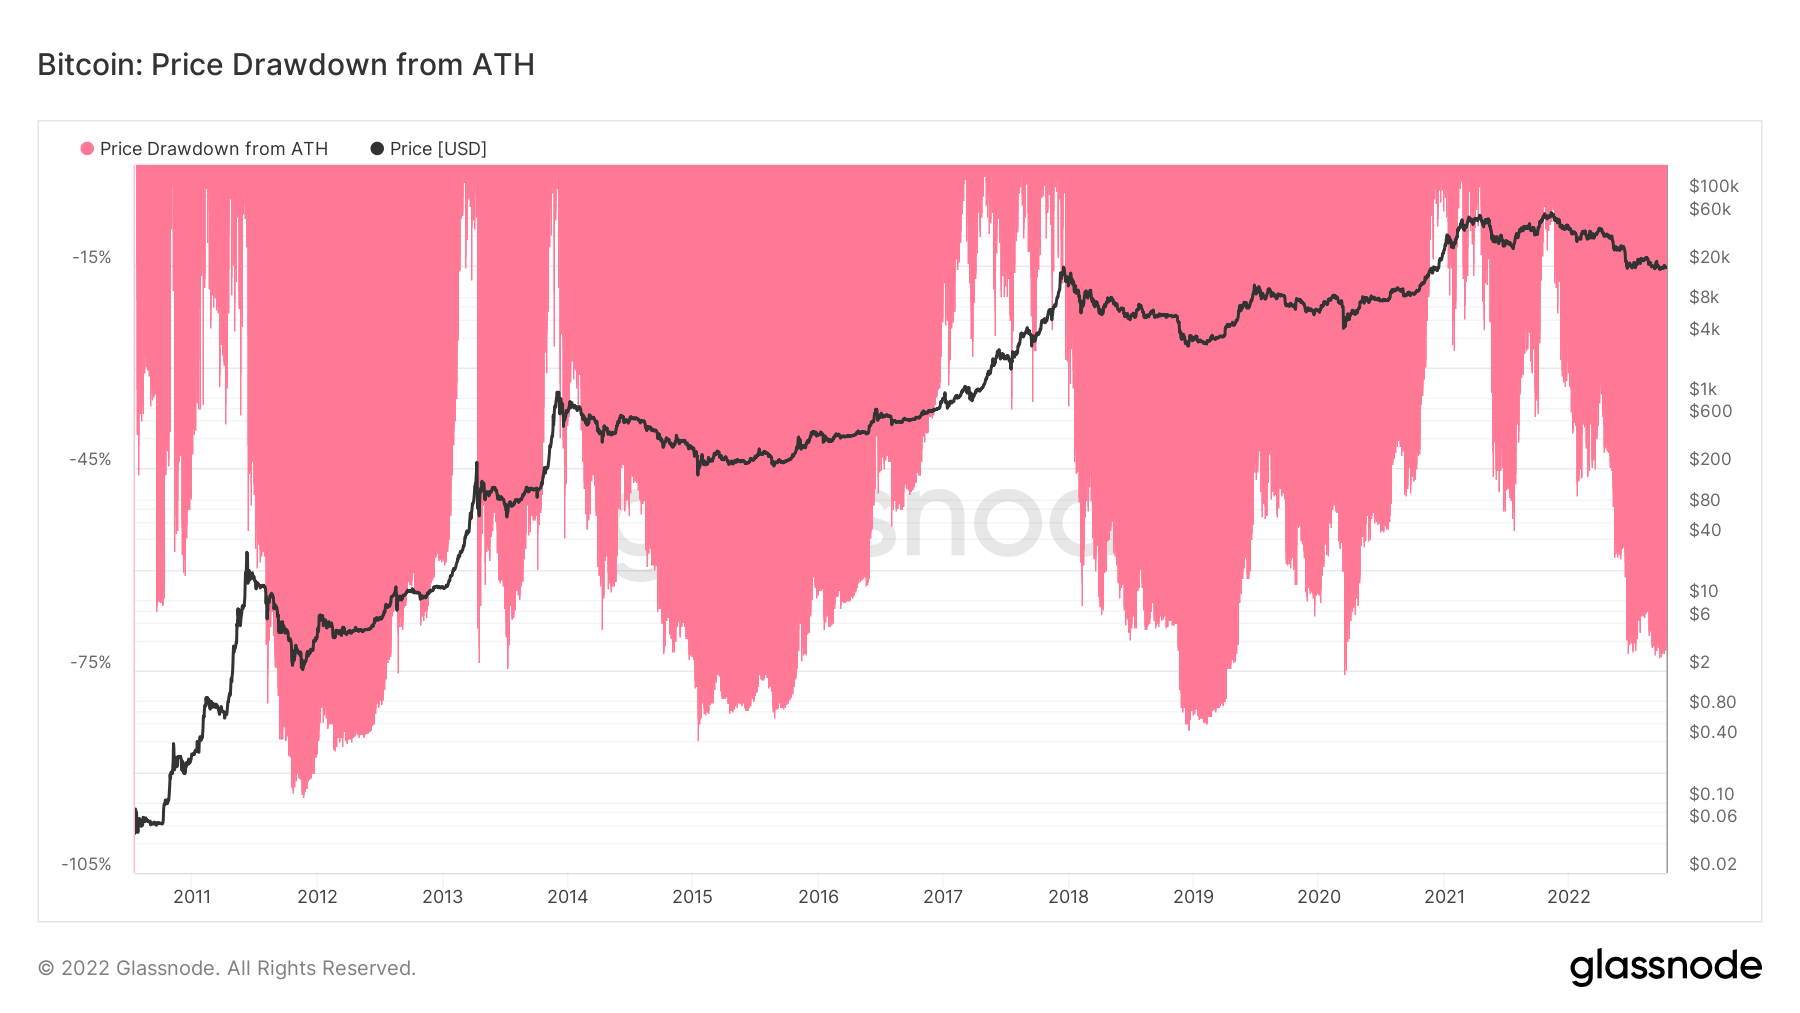
Bitcoin drawdown from all-time highs chart. Source: Glassnode
“Either, we bottom soon-ish or this time is different,” Maartunn, a contributor to on-chain analytics platform CryptoQuant, speculated in research last month.
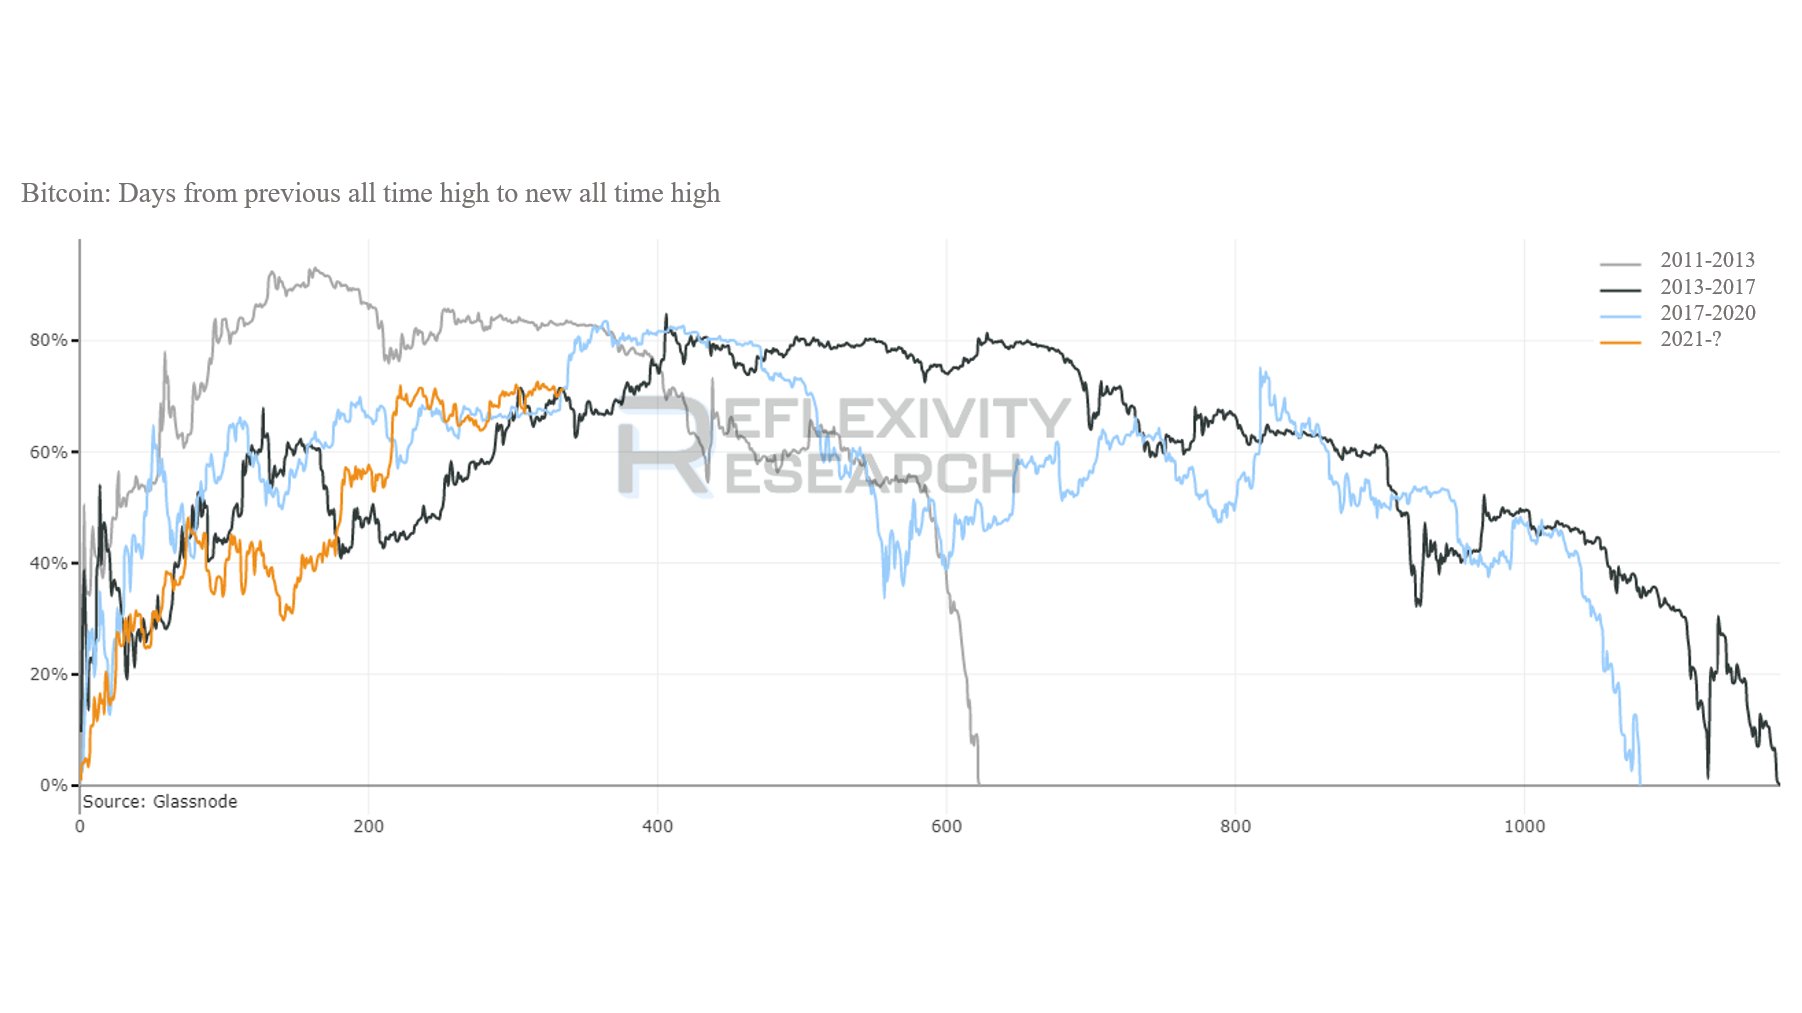
Bitcoin macro highs and lows comparison chart. Source: William Clemente/ Twitter
Sentiment data copies bears gone by
Looking at the will of the herd, it seems that it is very much “business as usual” in this Bitcoin bear market.
Related: Crypto traders shift their focus to altcoins while Bitcoin price consolidates
According to the popular market gauge, the Crypto Fear & Greed Index, “extreme fear” still reigns supreme in crypto — as it has done for much of 2022.
With a score of 22/100, Fear & Greed has been in its lowest zone for multiple weeks. Earlier in the year, it saw its longest-ever “extreme greed” stint at more than two months.
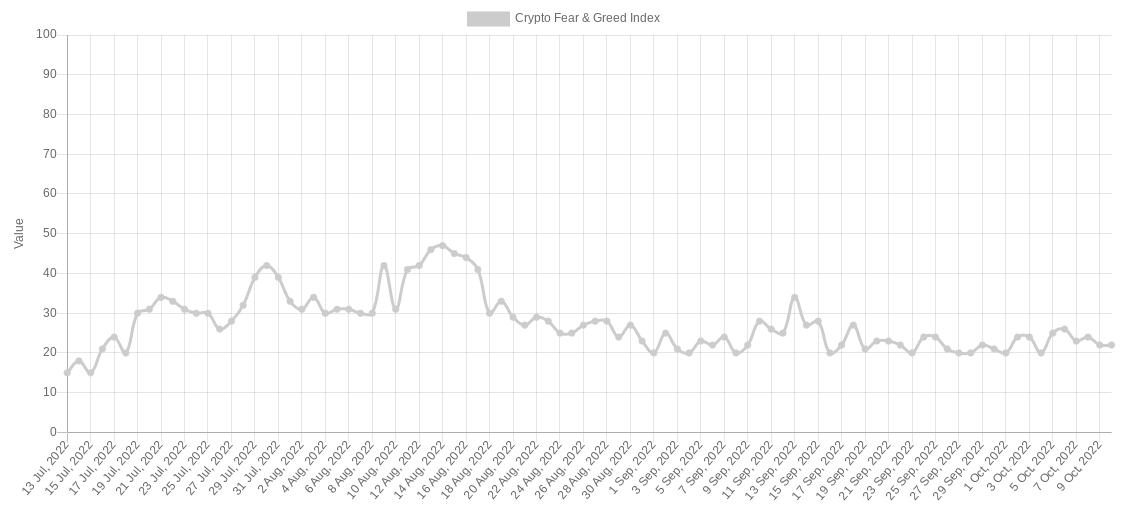
Crypto Fear & Greed Index (screenshot). Source: Alternative.me
Nonetheless, for popular trading resource Stockmoney Lizards, there is nothing to see here — everything is going to plan this time around compared to previous Bitcoin halving cycles.
“In terms of timing, this current cycle ressembles the last one a lot,” it declared on the day alongside a comparative chart.
“This chart is merely descriptive, but depicts the repetitive nature of Bitcoin sentiment phases very well.”
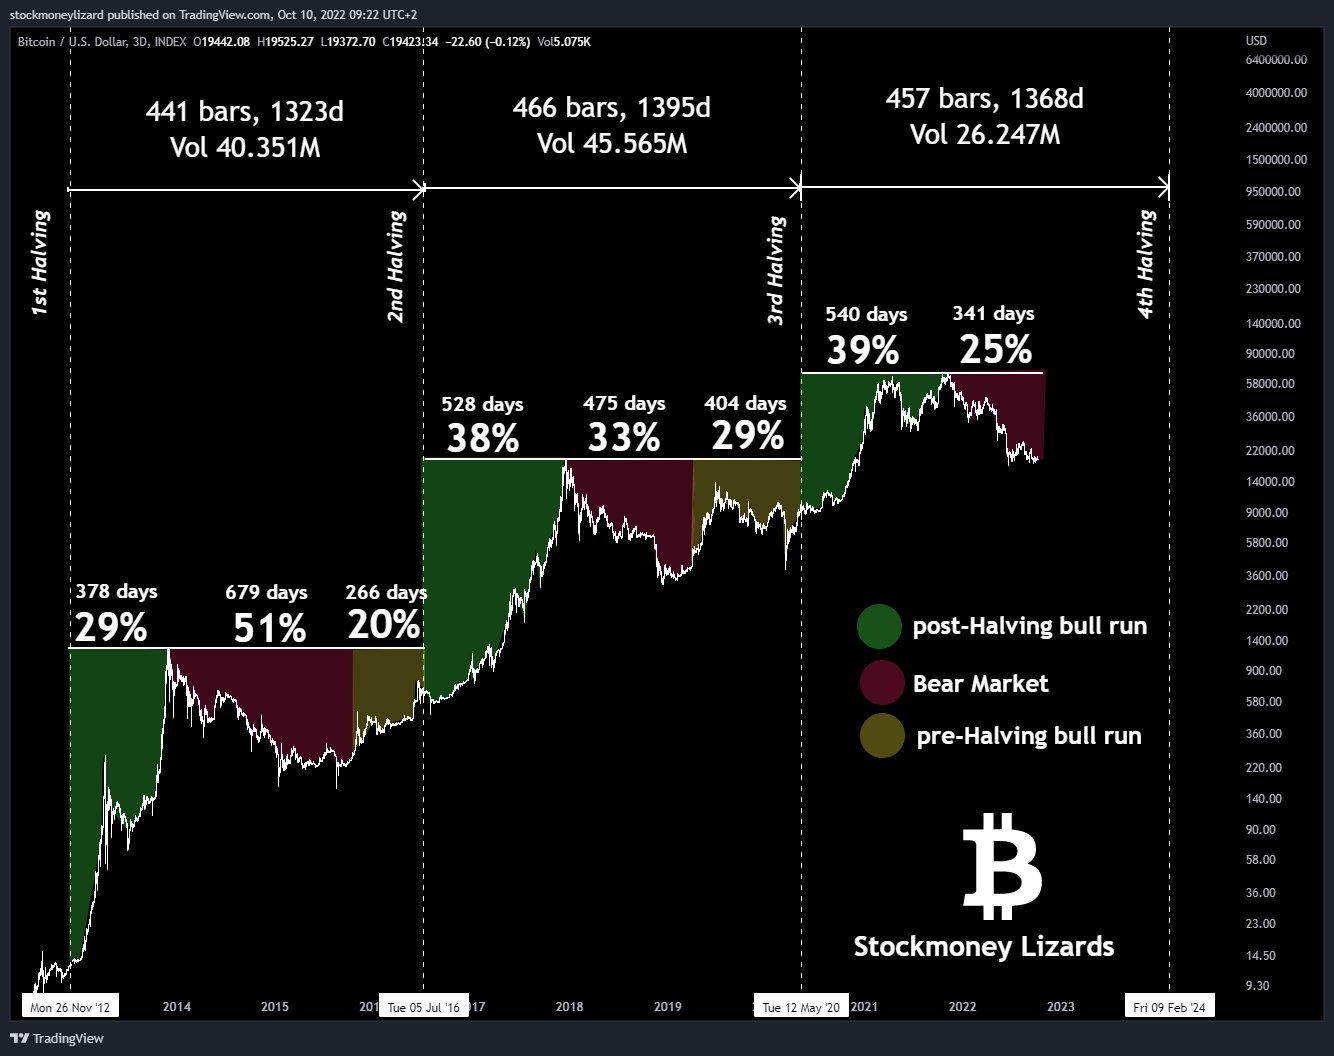
Bitcoin halving cycle phases annotated chart. Source: Stockmoney Lizards/ Twitter
The pit of the latest red trough, then, could be the next major cycle feature.
The views and opinions expressed here are solely those of the author and do not necessarily reflect the views of Cointelegraph.com. Every investment and trading move involves risk, you should conduct your own research when making a decision.


 Bitcoin
  Ethereum
  Tether
  USDC
USDC  TRON
TRON  Dogecoin
  Cardano
  Bitcoin Cash
  LEO Token
  Zcash
Zcash  Chainlink
  Monero
  Stellar
  Litecoin
  Hedera
  Dai
Dai  Cronos
  OKB
OKB  Tether Gold
  Ethereum Classic
  KuCoin
  Gate
Gate  Algorand
  Cosmos Hub
  VeChain
  Dash
Dash  Tezos
Tezos  TrueUSD
  Stacks
  IOTA
IOTA  Basic Attention
  Decred
  Theta Network
  NEO
NEO  Synthetix
  Qtum
Qtum  0x Protocol
  Ravencoin
  DigiByte
  Nano
Nano  Zilliqa
  Siacoin
  Numeraire
  Waves
Waves  Ontology
  Enjin Coin
  BUSD
BUSD  Status
  Hive
Hive  Pax Dollar
  Lisk
Lisk  Steem
Steem  Huobi
Huobi  OMG Network
  NEM
NEM  Bitcoin Gold
  Augur
Augur  Bitcoin Diamond
  HUSD
HUSD