Bitcoin Hovers above $20,000 for a Possible Rebound

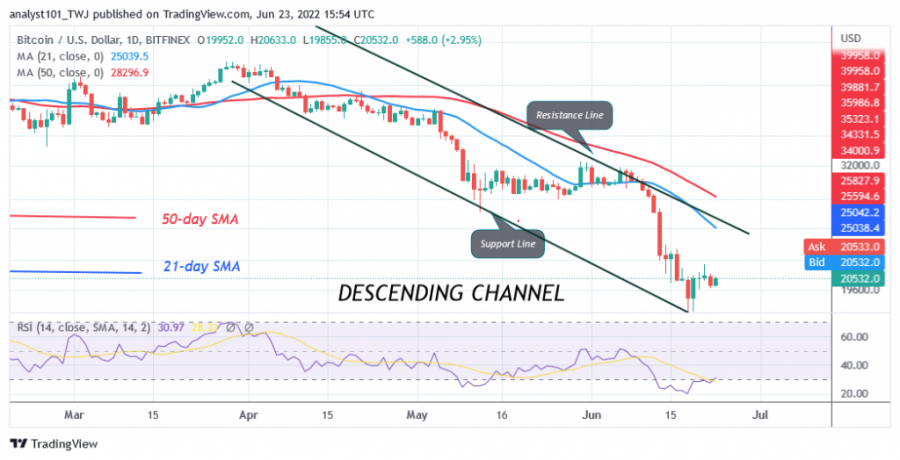
Bitcoin (BTC) exchange rate has been trading above $20,000 since June 19. The cryptocurrency’s brief rally was staved off by the bears on June 21. The largest cryptocurrency is now forced to trade between $20,060 and $21,500. In short, the BTC price is trading at $20,450 at press time.
On the upside, the BTC price was pushed off at the high of $21,675 with a long candle wick. The long candle wick indicates that the region is a strong selling point. If the BTC price rises above the $20,000 support, it will break the $22,000 resistance zone. The bullish momentum will push the bitcoin price to the psychological $30,000 mark. Nevertheless, continued fluctuations above the $20,000 support will cause Bitcoin to fall back to the previous low.
Bitcoin indicator reading
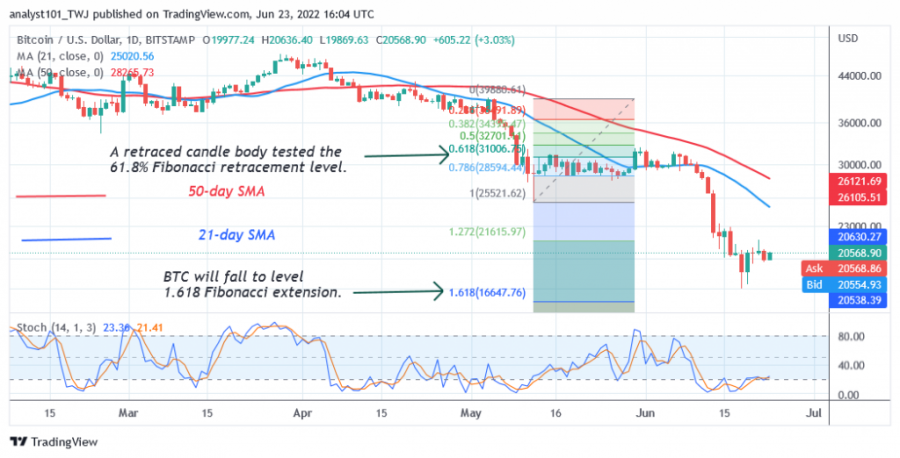
Bitcoin is at level 31 on the Relative Strength Index for period 14. Buyers are emerging in the oversold region to push Bitcoin higher. BTC price is above the 25% area of the daily stochastic. Bitcoin is gradually resuming its uptrend. The 21-day line SMA and the 50-day line SMA are sloping downwards, indicating a downtrend.

Technical indicators:
Major Resistance Levels — $30,000 and $35,000
Major Support Levels — $25,000 and $20,000
What is the next direction for BTC?
According to the price indicator, the Bitcoin (BTC) price is likely to continue to decline as it trades just above the $20,000 support level. Meanwhile, on May 13 downtrend, a retraced candle body tested the 61.8% Fibonacci retracement level. The retracement suggests that BTC will fall to the 1.618 Fibonacci extension level or $16,647.

Disclaimer. This analysis and forecast are the personal opinions of the author and are not a recommendation to buy or sell cryptocurrency and should not be viewed as an endorsement by CoinIdol. Readers should do their research before investing funds.


 Bitcoin
  Ethereum
  Tether
  USDC
USDC  TRON
TRON  Dogecoin
  Cardano
  Monero
  Bitcoin Cash
  Chainlink
  LEO Token
  Stellar
  Zcash
Zcash  Litecoin
  Hedera
  Dai
Dai  Cronos
  OKB
OKB  Tether Gold
  Ethereum Classic
  KuCoin
  Cosmos Hub
  Gate
Gate  Algorand
  VeChain
  Dash
Dash  Stacks
  Tezos
Tezos  TrueUSD
  Decred
  IOTA
IOTA  Theta Network
  Basic Attention
  NEO
NEO  Synthetix
  Qtum
Qtum  Ravencoin
  0x Protocol
  DigiByte
  Zilliqa
  Nano
Nano  Siacoin
  Numeraire
  Waves
Waves  Ontology
  Status
  Enjin Coin
  Hive
Hive  BUSD
BUSD  Pax Dollar
  Lisk
Lisk  Steem
Steem  Huobi
Huobi  OMG Network
  Bitcoin Gold
  NEM
NEM  Augur
Augur