Bitcoin Price Below Psychological Level $22,000; Is The Next Stop At $17,000?

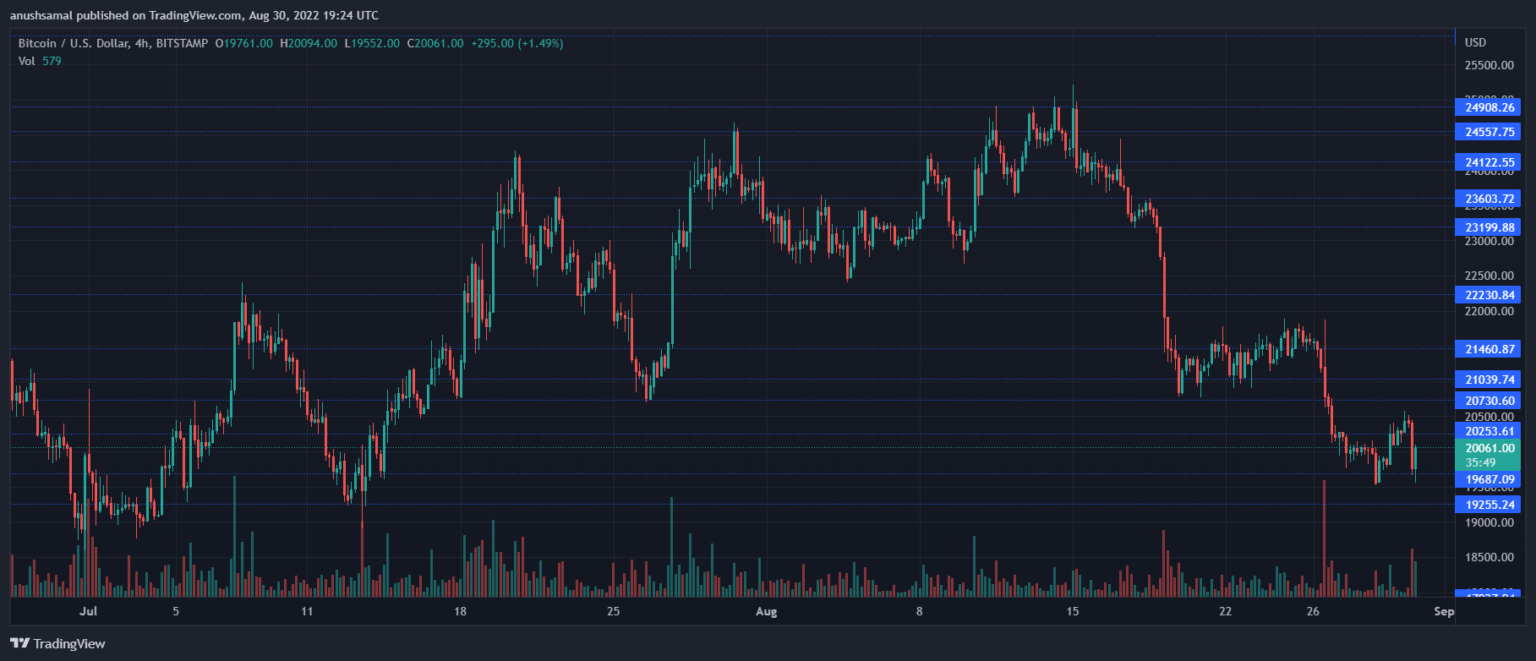
Bitcoin price over the last 24 hours moved south on its four-hour chart. Very recently Bitcoin had rose above the $20,000 price mark but the bears failed to hold the asset at that price mark.
In the last 24 hours, the coin was mostly consolidating on its chart.
In the past week, BTC fell by 9%. There was substantial demand in the lower levels. The less demand in return was pulling the price of the crypto below the immediate resistance mark.
The technical outlook for the coin was bearish given how sellers were active in the market at the time of writing.
If buyers don’t return to the market, Bitcoin price will trade near its closest price level. It will aim for a support level underneath that.
It is important that the coin moves above the $20,000 price level in the next trading sessions else it would fall below the $18,000 price level.
The global cryptocurrency market cap today is $996 Billion, with a 2.7% negative change in the last 24 hours.
Bitcoin Price Analysis: Four-Hour Chart

BTC was trading for $20,600 at the time of writing. For the most part in the last 24 hours, the coin was struggling below the $20,000 price mark.
The coin is still quite unstable at the moment, it is to be seen how long the Bitcoin price will remain above that price mark.
The next stop for BTC if it doesn’t trade near the next resistance level will be at $18,000. Overhead resistance for the coin stood at $21,100.
If the coin travels above that then the next attempt would be to touch $22,000. On the flip side, if BTC was unable to remain above the $18,000 mark, $17,000 doesn’t seem unlikely.
Technical Analysis

BTC had depicted increased sell strength as prices fell. This indicated that there was a demand at lower price levels.
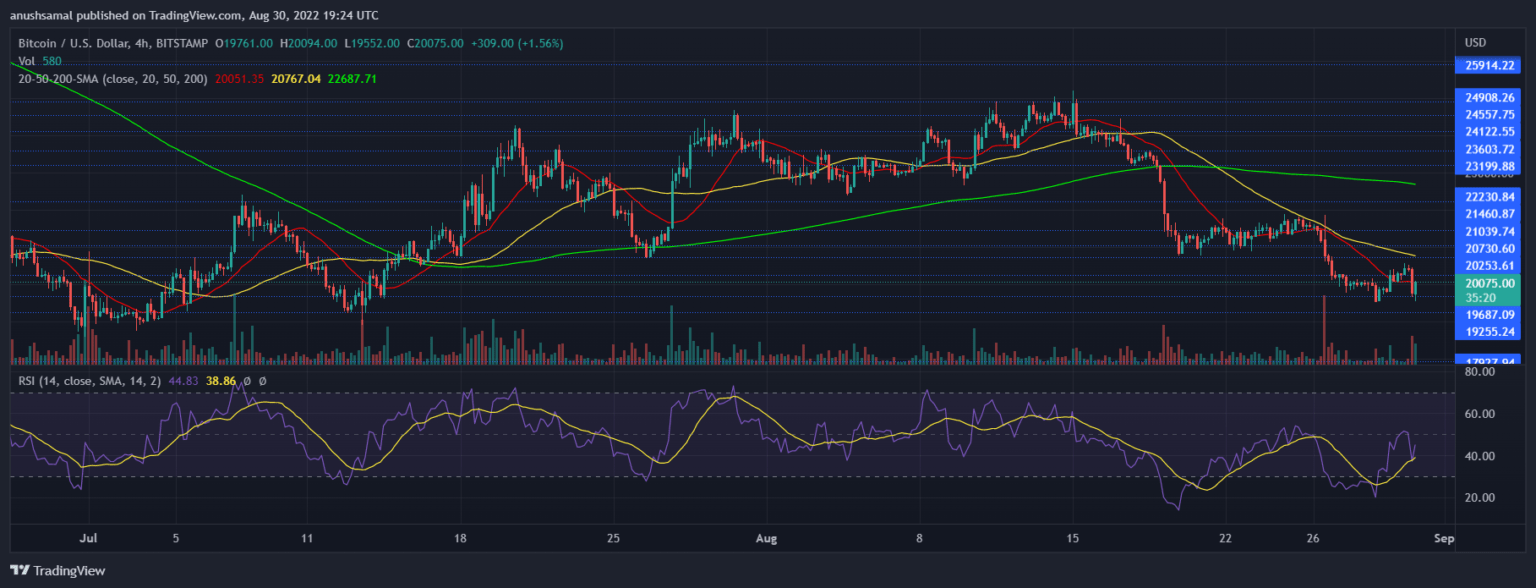
The technical indicators also displayed increased bearish momentum. The Relative Strength Index was below the half-line which meant sellers were more than buyers in the market.
Bitcoin price was below the 20-SMA line, this reading is an indication that sellers were driving the price momentum in the market.

The coin’s other technical indicators also indicated that the buying strength was picking up on the four-hour chart.
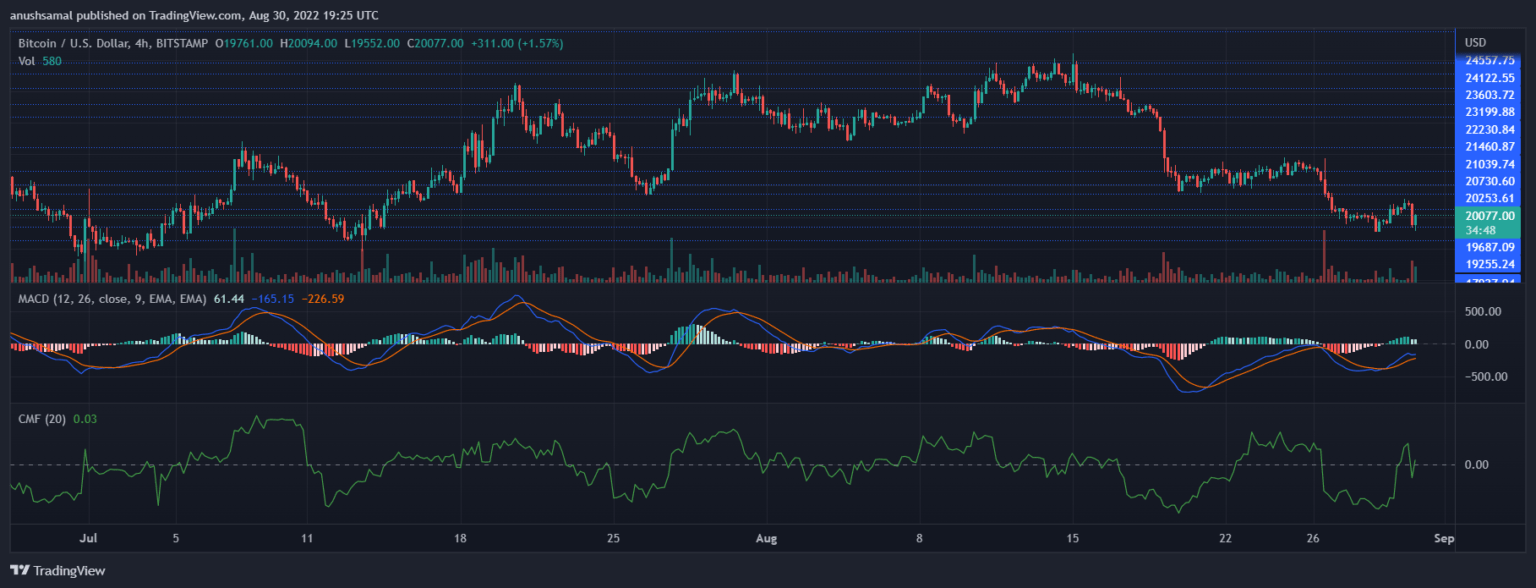
Moving Average Convergence Divergence indicated the momentum and change in the coin’s price trend.
MACD was still positive with green histograms on the half-line which pointed towards a buy signal. Chaikin Money Flow signals capital inflows and outflows.
CMF was peeking above the half-line suggesting that capital inflows just exceeded the capital outflows.


 Bitcoin
  Ethereum
  Tether
  USDC
USDC  TRON
TRON  Dogecoin
  Cardano
  Bitcoin Cash
  Chainlink
  Monero
  LEO Token
  Stellar
  Zcash
Zcash  Litecoin
  Hedera
  Dai
Dai  Cronos
  Tether Gold
  OKB
OKB  Ethereum Classic
  KuCoin
  Cosmos Hub
  Algorand
  Gate
Gate  VeChain
  Stacks
  Tezos
Tezos  TrueUSD
  Dash
Dash  IOTA
IOTA  Basic Attention
  Theta Network
  NEO
NEO  Decred
  Synthetix
  Qtum
Qtum  Ravencoin
  0x Protocol
  DigiByte
  Zilliqa
  Nano
Nano  Siacoin
  Numeraire
  Waves
Waves  Status
  Ontology
  Enjin Coin
  Hive
Hive  BUSD
BUSD  Pax Dollar
  Lisk
Lisk  Steem
Steem  Huobi
Huobi  OMG Network
  NEM
NEM  Bitcoin Gold
  Augur
Augur  Bitcoin Diamond