Bitcoin Price Surges Above $22,000 But Will The Momentum Last?

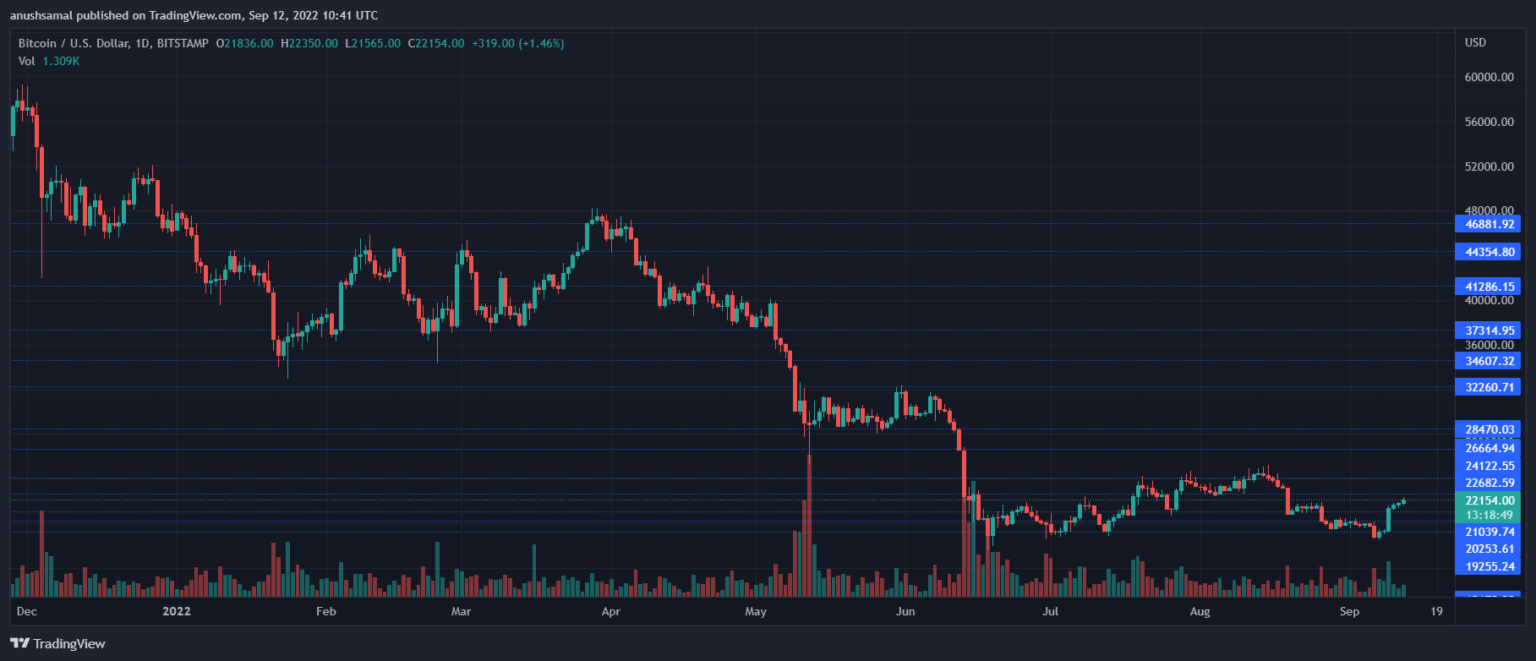
Bitcoin price displayed strength over the last four days as it finally broke past the $19,000 price zone.
Bitcoin price was consolidating over the past week before this rally. At the moment, the $18,000 price level is acting as strong support for the coin.
Even though the Bitcoin price has stabilized, the $18,000-$19,000 price range remains critical.
If the cryptocurrency fails to trade above its present level and falls near $18,000, its next trading zone will be at $15,000. Buyers seem to have returned to the market owing to the relief rally.
Technical indicators have also painted a bullish picture for Bitcoin on the daily chart. Demand for Bitcoin has to remain constant in order for the coin to stay optimistic on its daily chart.
The coin could go to $24,000. However, that price level may prove to be a strong barrier for Bitcoin.
That could in turn push the price of Bitcoin to its closest support line. If Bitcoin manages to hold above $22,000, there are chances that it could trade close to $24,000.
Bitcoin Price Analysis: One Day Chart

BTC was trading at $22,100 at the time of writing. However, there has been a relief rally in recent days after a period of consolidation.
The immediate resistance for the coin stood at $24,000, but the aforementioned level could prove to be a strong resistance mark for Bitcoin.
Local support for the coin was at $19,000 and then at $18,000. If Bitcoin reaches $18,000, it is possible that it will aim for $15,000.
The volume of Bitcoin traded in the last session declined, which was a sign of increased selling pressure.
Technical Analysis

BTC has been flashing signs of optimism over the last couple of days.
It is still to be seen how Bitcoin price fares above the $22,000 price mark.
The outlook for Bitcoin price has turned positive, with buying strength increasing over the past few trading sessions.
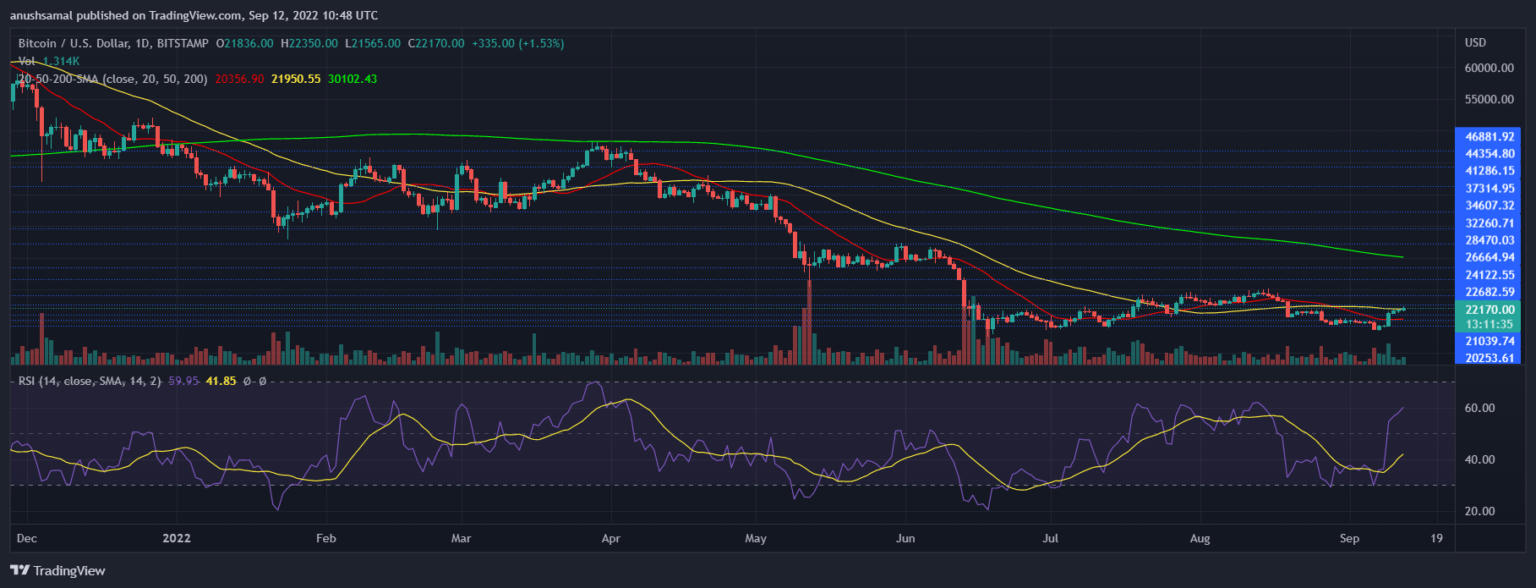
The Relative Strength Index was above the half-line, which indicated that buyers outnumbered sellers at the time of writing.
Bitcoin price travelled above the 20-SMA line, signalling that buyers were driving price momentum in the market.
Increased demand would push the 20-SMA line to crossover the 50-SMA line, thereby increasing the chance of bullishness.

Other technical indicators of Bitcoin also seemed to side with the bulls at press time. The overall price direction of the coin was positive, as depicted by the technical indicators.
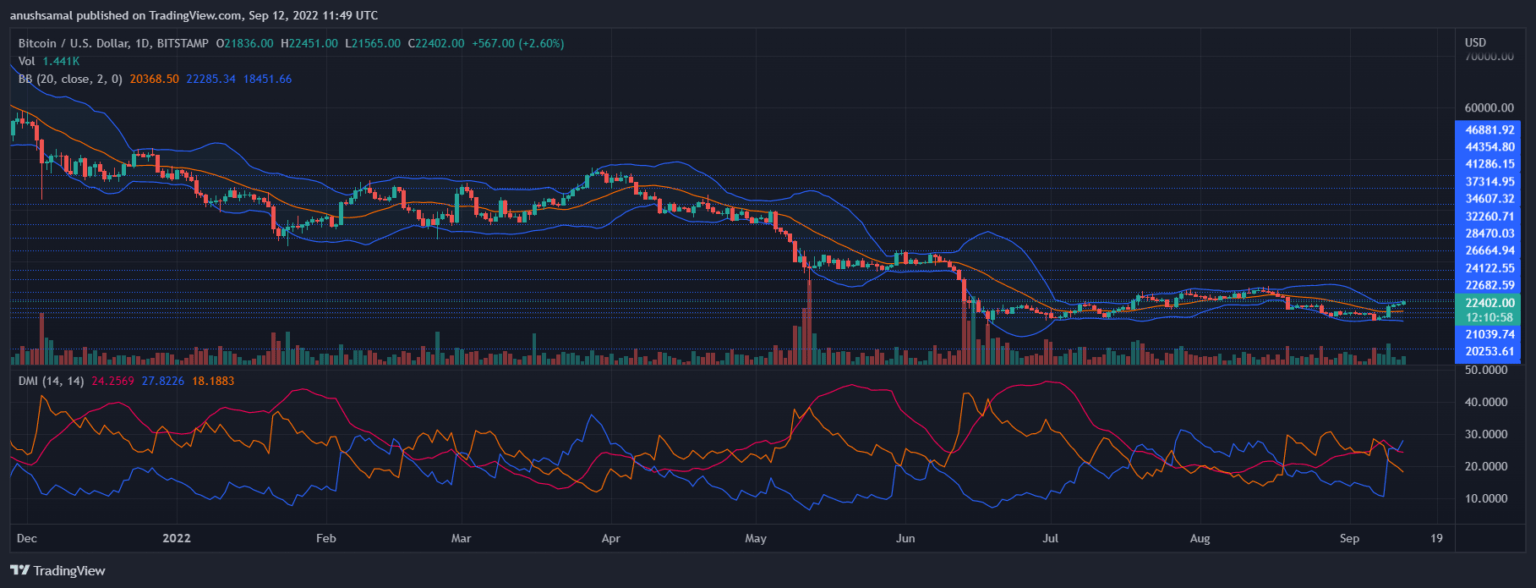
The Directional Movement Index was positive, with the +DI line above the -DI line. However, the Average Directional Index (red) sagged slightly.
This meant that price momentum could lose steam. Bollinger Bands indicate volatility, and the slight opening of the bands means that there could be a chance of a price fluctuation.


 Bitcoin
  Ethereum
  Tether
  USDC
USDC  TRON
TRON  Dogecoin
  Cardano
  Bitcoin Cash
  Chainlink
  LEO Token
  Monero
  Zcash
Zcash  Stellar
  Litecoin
  Hedera
  Dai
Dai  Cronos
  OKB
OKB  Tether Gold
  Ethereum Classic
  KuCoin
  Gate
Gate  Algorand
  Cosmos Hub
  VeChain
  Stacks
  Tezos
Tezos  Dash
Dash  TrueUSD
  IOTA
IOTA  Basic Attention
  Theta Network
  Decred
  NEO
NEO  Synthetix
  Qtum
Qtum  Ravencoin
  0x Protocol
  DigiByte
  Zilliqa
  Nano
Nano  Siacoin
  Numeraire
  Waves
Waves  Status
  Ontology
  Enjin Coin
  Hive
Hive  BUSD
BUSD  Pax Dollar
  Lisk
Lisk  Steem
Steem  Huobi
Huobi  NEM
NEM  OMG Network
  Bitcoin Gold
  Bitcoin Diamond
  Augur
Augur