Crypto Analyst CryptoCapo Predicts BTC Bottom Could Reach $11.5K

Crypto Analyst CryptoCapo made a succinct statement wherein he pointed out that in the phase where altcoins shred 50-90% of their price, the potential bottom that BTC could reach was in the range between $11,500-$12,000.
A chart is worth a thousand words. pic.twitter.com/bZ2TKpnLFs
— il Capo Of Crypto (@CryptoCapo_) January 3, 2023
He conveyed his message by saying that a chart was worth a thousand words. The analyst made this comment by paraphrasing the saying that goes, “a picture is worth a thousand words”.
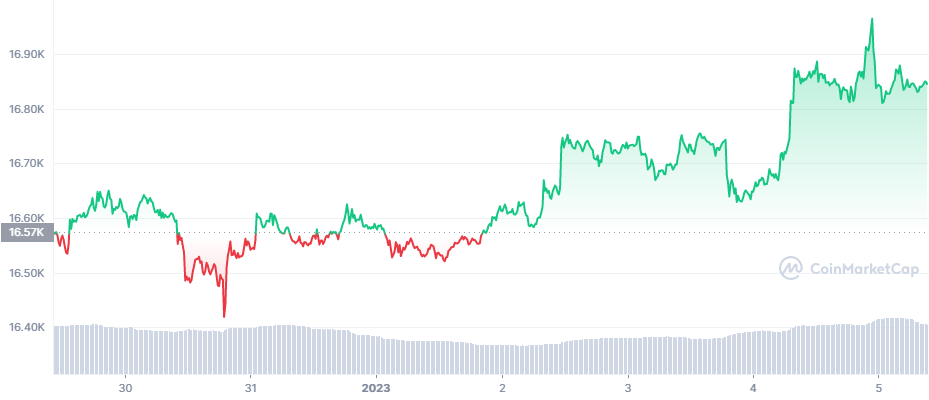
BTC opened the market for the past week trading at $16,570 as shown in the chart below. During the first four days of the past week, BTC fluctuated in and out of the red zone, but by the end of the week, BTC recovered. During the last few hours of January 1( the third day of the week), the bulls helped BTC trade above its opening market price.
Since the bulls gave momentum, BTC has been trading in the green zone. Currently, BTC is down 0.07% in the past 24 hours and is trading at $16,844.55.

MANA/USDT 7-day Trading Chart (Source: CoinMarketCap)
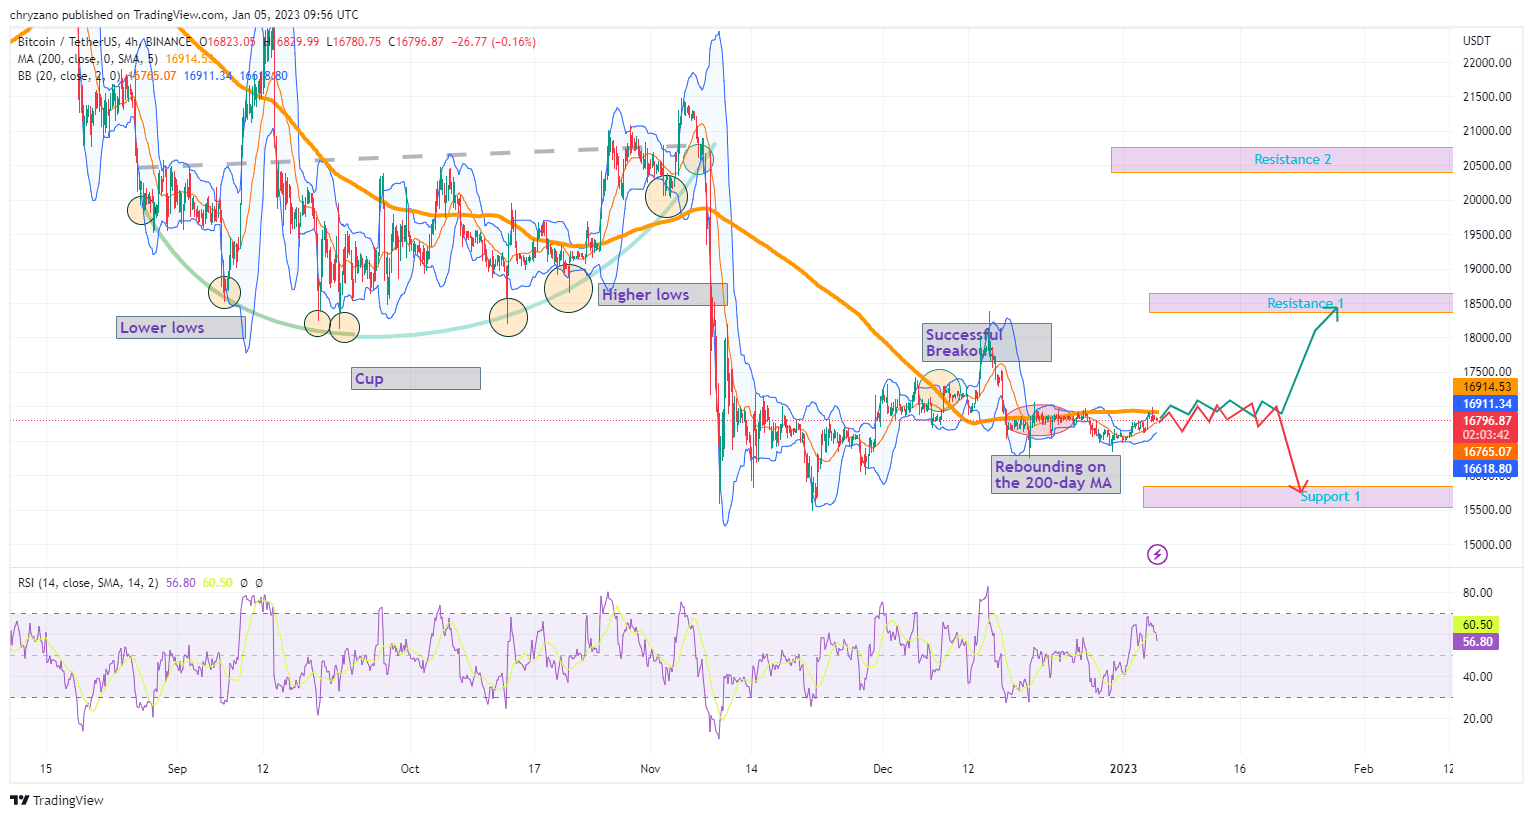
BTC has been forming the shape of a cup since late August, as denoted in the chart below. It made new lower lows from late August to late September. However, since mid-October, BTC has gained some momentum and made higher lows (Circle). Once BTC formed the brim of the cup close to resistance 2, it tumbled.

BTC/USDT 4h Trading Chart (Source: TradingView)
The prices fell from $20,886 to $15,604 within 24 hours. Since this fall, BTC has been fluctuating between Support 1(≈$15,800) and Resistance 1 (≈$18,500). Notably, after this fall, BTC has been trading below the 200-day MA (yellow). BTC tested the 200-day MA recently and broke it.
However, it wasn’t able to keep the position that it gained. And it fell below the 200-day MA shortly after breaking it. After rebounding on the 200-day MA in late December, BTC is testing the 200-day MA again. If the bulls push hard, BTC will be able to break the 200-day MA and reach resistance 1.
However, if the bears take over the market, BTC could land on Support 1. Moreover, the RSI is 56.41, denoting that the trend of sideways movement will continue. Additionally, BTC has touched the upper Bollinger band; hence the market could correct the price.
Disclaimer: The views and opinions, as well as all the information shared in this price analysis, are published in good faith. Readers must do their own research and due diligence. Any action taken by the reader is strictly at their own risk, Coin Edition and its affiliates will not be held liable for any direct or indirect damage or loss.


 Bitcoin
  Ethereum
  Tether
  USDC
USDC  TRON
TRON  Dogecoin
  Cardano
  Bitcoin Cash
  Monero
  Chainlink
  LEO Token
  Stellar
  Zcash
Zcash  Litecoin
  Hedera
  Dai
Dai  Cronos
  Tether Gold
  OKB
OKB  Ethereum Classic
  KuCoin
  Cosmos Hub
  Gate
Gate  Algorand
  VeChain
  Stacks
  Tezos
Tezos  Dash
Dash  TrueUSD
  IOTA
IOTA  Theta Network
  Decred
  Basic Attention
  NEO
NEO  Synthetix
  Qtum
Qtum  Ravencoin
  0x Protocol
  Zilliqa
  DigiByte
  Nano
Nano  Holo
Holo  Siacoin
  Numeraire
  Waves
Waves  Ontology
  Status
  Enjin Coin
  BUSD
BUSD  Hive
Hive  Pax Dollar
  Lisk
Lisk  Steem
Steem  Huobi
Huobi  OMG Network
  Bitcoin Gold
  NEM
NEM  Augur
Augur  Bitcoin Diamond