Decoding Bitcoin’s Trading Pattern for June 2023

- In this article, we will analyse the trading price analysis of Bitcoin.
- The trading volume of BTC has witnessed a decline of 43.18%.
The crypto market has experienced a lot of ups and downs since the start of 2023. Among the other cryptocurrencies, Bitcoin (BTC), the largest cryptocurrency by market capitalization, started the 2023 year with a strong bullish trend. BTC has reached the 30K mark at the start of the year.
However, the trading price of BTC has started dropping after reaching this level. In this article, we will analyse the trading price analysis of Bitcoin from 2021 to the present date. And also the factors and dynamics that have impacted the Bitcoin trading price. Examining the ups and downs of Bitcoin gives a deeper understanding of the past couple of years.
At the time of writing, the trading price of Bitcoin is around $27,157, with a decline of over 0.08% in the last 24 hours. The trading volume of BTC has witnessed a decline of 43.18%, according to CoinMarketCap.
Bitcoin Trading Price Analysis
This analysis provides valuable information and a clearer understanding of the trading price of Bitcoin (BTC). The analysis was divided into periods of months and how the trading price got impacted in each period.

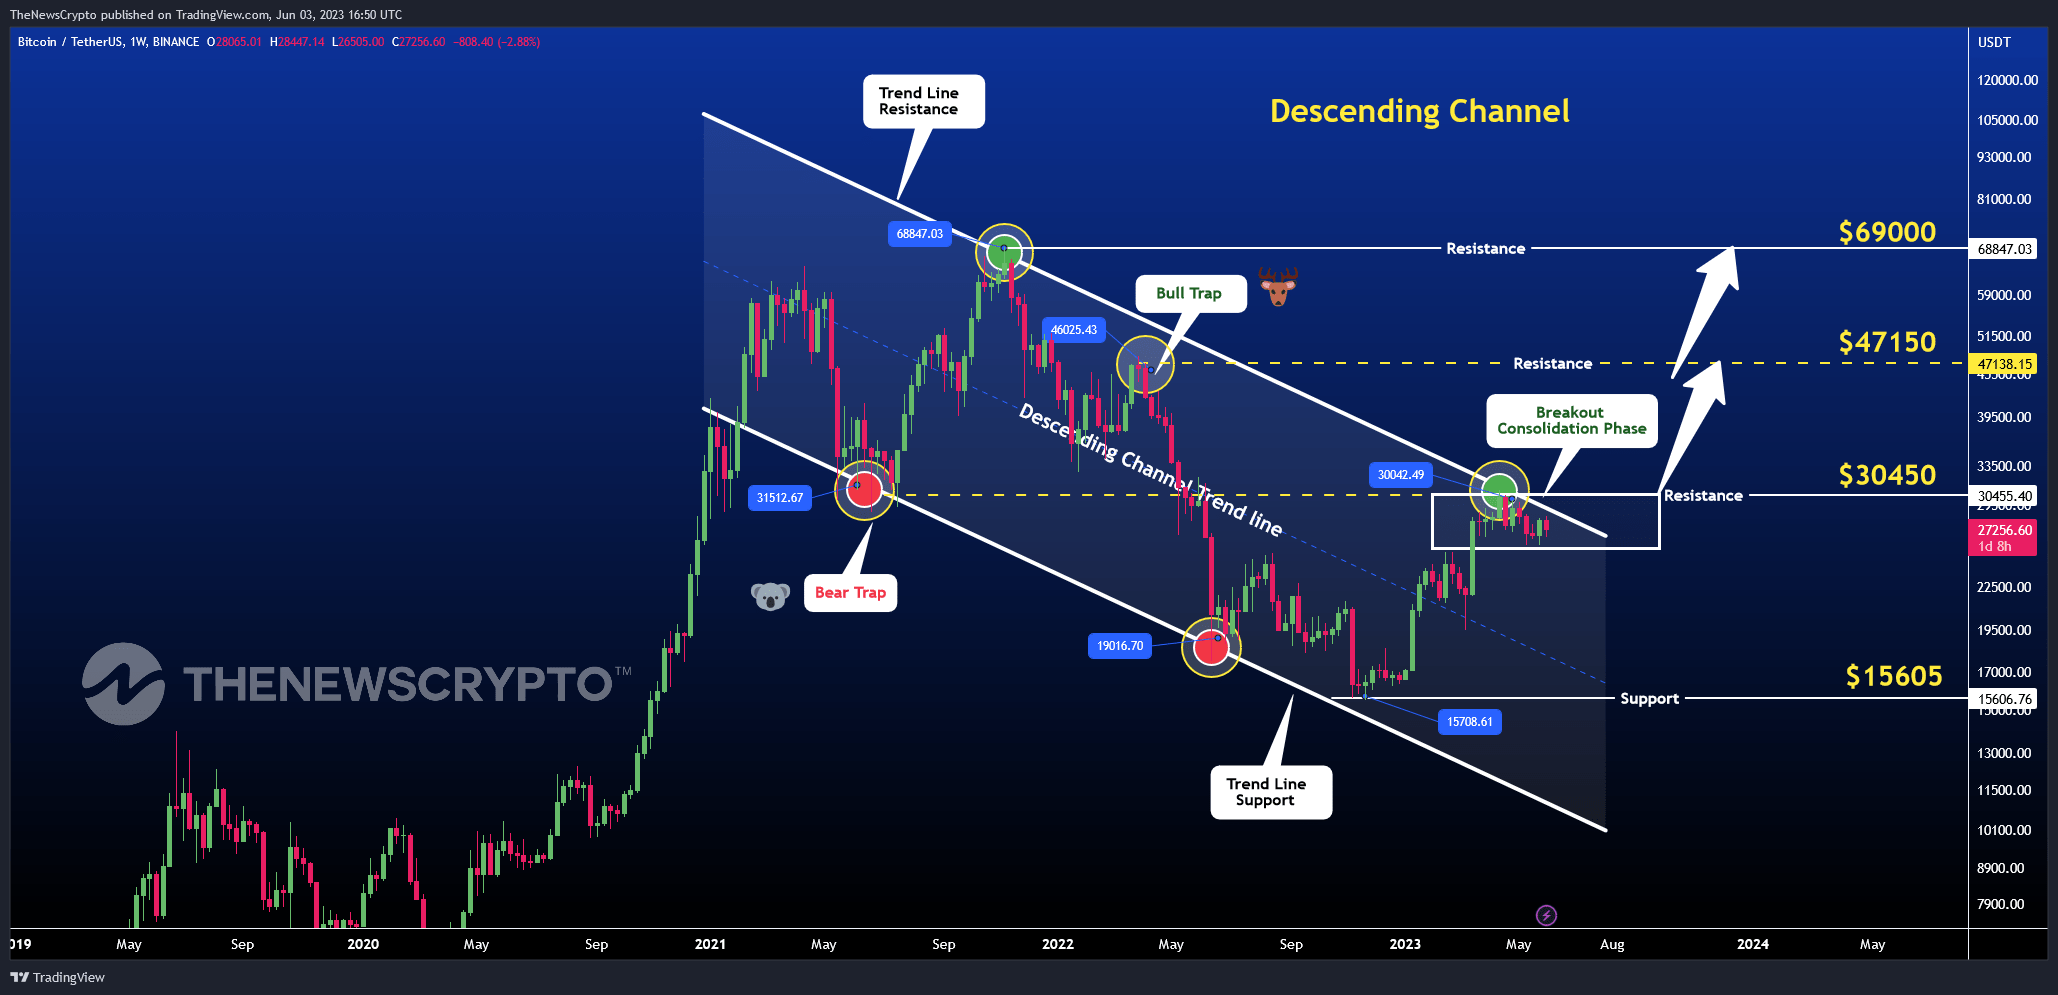
Bitcoin Trading Price Chart (Source: TradingView)
According to the trading chart, clearly shows that the Bitcoin trading price has experienced a descending channel pattern since 2022. Moreover, we will examine the significance of support and the resistance levels within the descending channel pattern by decoding the Bitcoin impact over a set of periods.
Decoding Bitcoin’s Descending Channel Pattern: Analyzing Key Phases and Future Price Implications
Bitcoin’s Descending Channel Pattern has offered both opportunities and challenges for traders since February 2021. Examining each period through a technical lens reveals potential implications for future price movements.
Period: Feb 2021 to Mid-Jul 2021 (50% Valuation Loss)
During this phase, Bitcoin entered the Descending Channel Pattern, displaying a four-phase Wyckoff structure on the daily timeframe. With a high of $64,854 and a low of $29,278, Bitcoin experienced a significant 50% price decline, indicating a prevailing bearish trend.
Period: Mid-Jul 2021 to Mid-Nov 2021 (230% Valuation Gain)
This phase witnessed an impressive bull run for Bitcoin. Surging from a low of $29,278 to a high of $69,000, Bitcoin recorded substantial gains of approximately 230%, reflecting a prevailing bullish trend.
Period: Mid-Nov 2021 to Early-Nov 2022 (80% Valuation Loss)
Bitcoin faced challenges in this period, characterized by significant volatility and market traps. With a low of $15,588, Bitcoin experienced an 80% valuation loss from its previous high of $69,000, signifying the continuation of a bearish trend.
Period: Early-Nov 2022 to Present (Potential 150% Gain)
A new bullish phase emerged during this period. Bitcoin rallied to a high of $31,000, representing a 100% valuation increase from the previous low. Currently consolidating near the Trend Line Resistance level within the $25,000 to $31,000 range, a breakout above the resistance could indicate a continuation of the bullish trend, potentially targeting the $47,000 level based on historical patterns
Conclusion:
It’s important for traders to understand the patterns and cycles that Bitcoin goes through before investing in it. The stages and pattern clearly suggest that BTC has gone through a descending channel pattern. Moreover, it clearly shows that it is expected to show a bullish trend in the upcoming days.
Disclaimer: The opinions expressed in this article are solely those of the writer and not of this platform. The data in the article is based on reports that we do not warrant, endorse, or assume liability for.


 Bitcoin
  Ethereum
  Tether
  USDC
USDC  TRON
TRON  Dogecoin
  Cardano
  Bitcoin Cash
  Monero
  Chainlink
  LEO Token
  Stellar
  Zcash
Zcash  Litecoin
  Hedera
  Dai
Dai  Cronos
  OKB
OKB  Tether Gold
  Ethereum Classic
  KuCoin
  Cosmos Hub
  Gate
Gate  Algorand
  VeChain
  Dash
Dash  Stacks
  Tezos
Tezos  TrueUSD
  IOTA
IOTA  Decred
  Theta Network
  Basic Attention
  NEO
NEO  Synthetix
  Qtum
Qtum  Ravencoin
  0x Protocol
  Zilliqa
  DigiByte
  Nano
Nano  Siacoin
  Numeraire
  Waves
Waves  Ontology
  Enjin Coin
  Status
  BUSD
BUSD  Hive
Hive  Lisk
Lisk  Pax Dollar
  Steem
Steem  Huobi
Huobi  OMG Network
  Bitcoin Gold
  NEM
NEM  Augur
Augur