ETH Technical Analysis: Bullish Patterns Shows A 50% Jump Potential

The ETH price action shows a bull run breaking multiple resistance levels and reaching the $2000 mark. But will this uptrend exceed the 200-day SMA?
Key Technical Points:
- The Ethereum (ETH) price has increased by almost 93% in the last month.
- The increasing possibility of a bullish crossover of the 50 and 100-day SMA reflects solid underlying bullishness.
- With a market cap of $243 billion, the intraday trading volume of Ethereum has decreased by 10% over the last 24 hours to reach $18.70 billion.
Past Performance of ETH
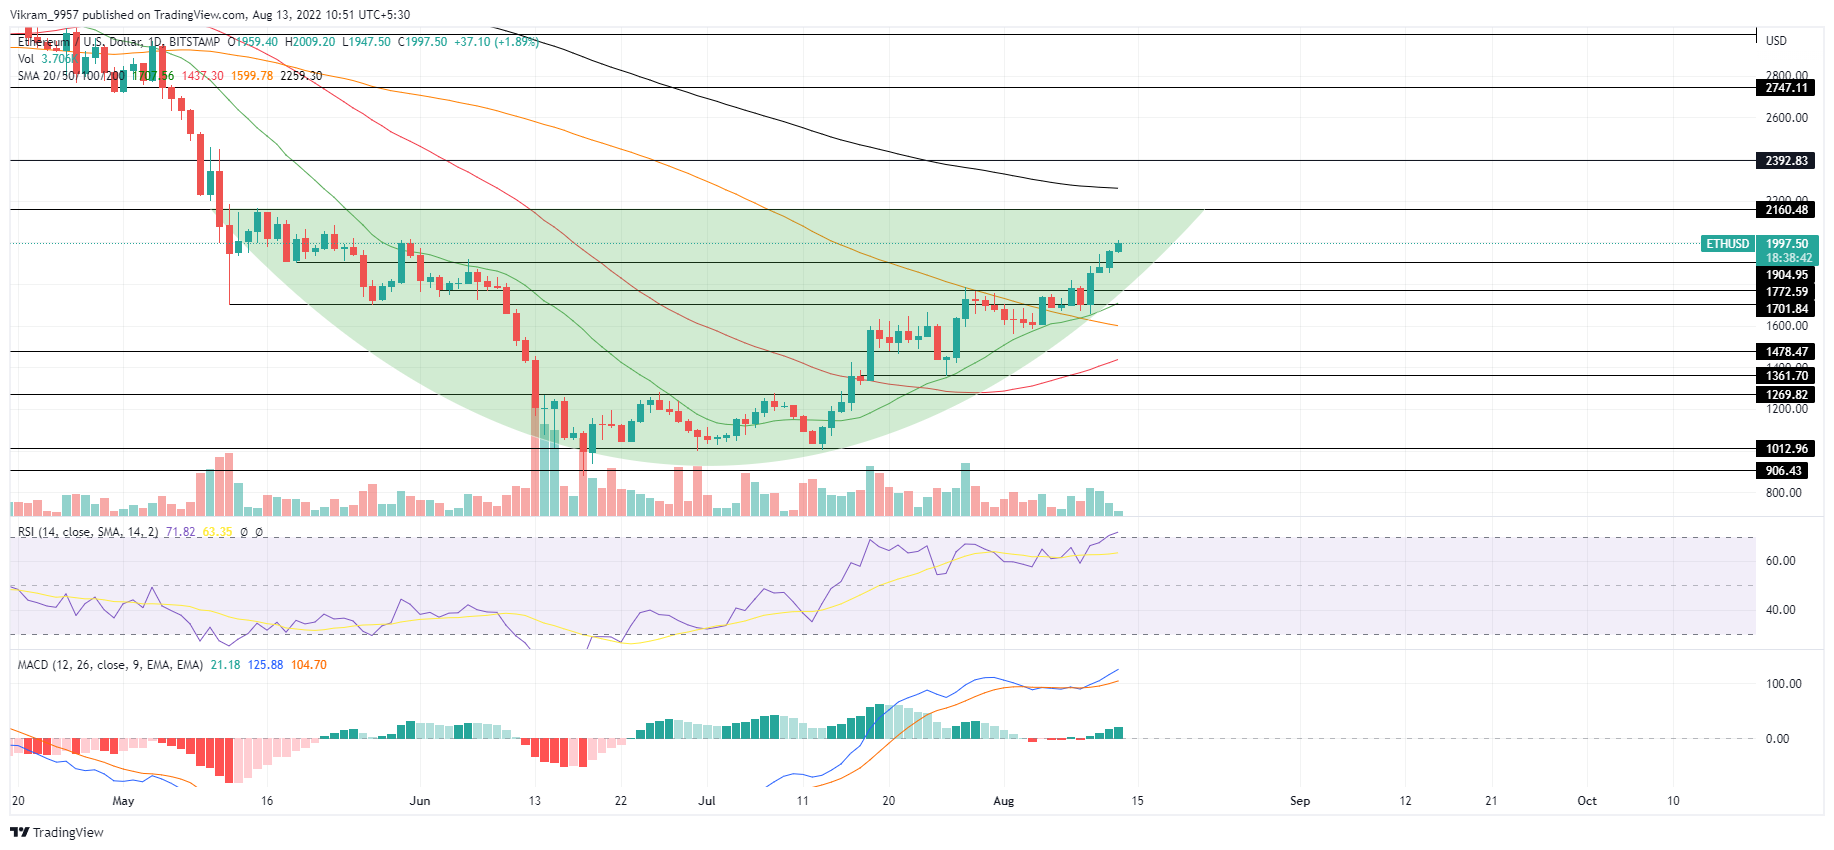
As mentioned in our previous article, the Ethereum (ETH) price trend breaks above the $1775 resistance level resulting in a price jump above the $1900 mark. As we predicted earlier, the uptrend may shortly reach the bullish milestone of $2000, accounting for a price jump of 16%. Furthermore, the streak of four continuous bullish candles reflects an improvement in the underlying bullishness.

Source — Tradingview
ETH Technical Analysis
The bullish reversal in ETH prices from the bottom support at the $1000 mark prepares a rounding bottom pattern formation in the daily chart. With a neckline at $2160, The bullish pattern shows potential to drive the uptrend to the $3000 mark upon a bullish breakout. The trend drives the market price closer to the 200-day SMA resulting in a higher likelihood of a bullish crossover between the 50 and 100-day SMA. The recent merger between the fast and slow lines regain the bullish alignment with a spike in the bullish histograms. Moreover, the RSI slope enters the overbought territory after exceeding the 14 days average line. Hence the technical indicators support the bullish analysis of price action. In a nutshell, the ETH technical analysis reflects a high likelihood of an uptrend continuation exceeding the $2000 mark.
Upcoming Trend
If the ETH price action completes a rounding bottom with a jump to $2160, a bullish breakout will fuel the uptrend to reach $3000. However, a bearish reversal will test the support level at the $1900 mark. Resistance Levels: $2160 and $2400 Support Levels: $1900 and $1772


 Bitcoin
  Ethereum
  Tether
  USDC
USDC  TRON
TRON  Dogecoin
  Cardano
  Monero
  Bitcoin Cash
  Chainlink
  LEO Token
  Stellar
  Zcash
Zcash  Litecoin
  Hedera
  Dai
Dai  Cronos
  OKB
OKB  Tether Gold
  Ethereum Classic
  KuCoin
  Cosmos Hub
  Gate
Gate  Algorand
  VeChain
  Stacks
  Dash
Dash  Tezos
Tezos  TrueUSD
  IOTA
IOTA  Decred
  Theta Network
  Basic Attention
  NEO
NEO  Synthetix
  Qtum
Qtum  Ravencoin
  0x Protocol
  Zilliqa
  DigiByte
  Nano
Nano  Holo
Holo  Siacoin
  Numeraire
  Waves
Waves  Ontology
  Enjin Coin
  Status
  Hive
Hive  BUSD
BUSD  Lisk
Lisk  Pax Dollar
  Steem
Steem  Huobi
Huobi  OMG Network
  Bitcoin Gold
  NEM
NEM  Augur
Augur