ETH Technical Analysis: Turmoil Increases For Ethereum Within Fib Levels

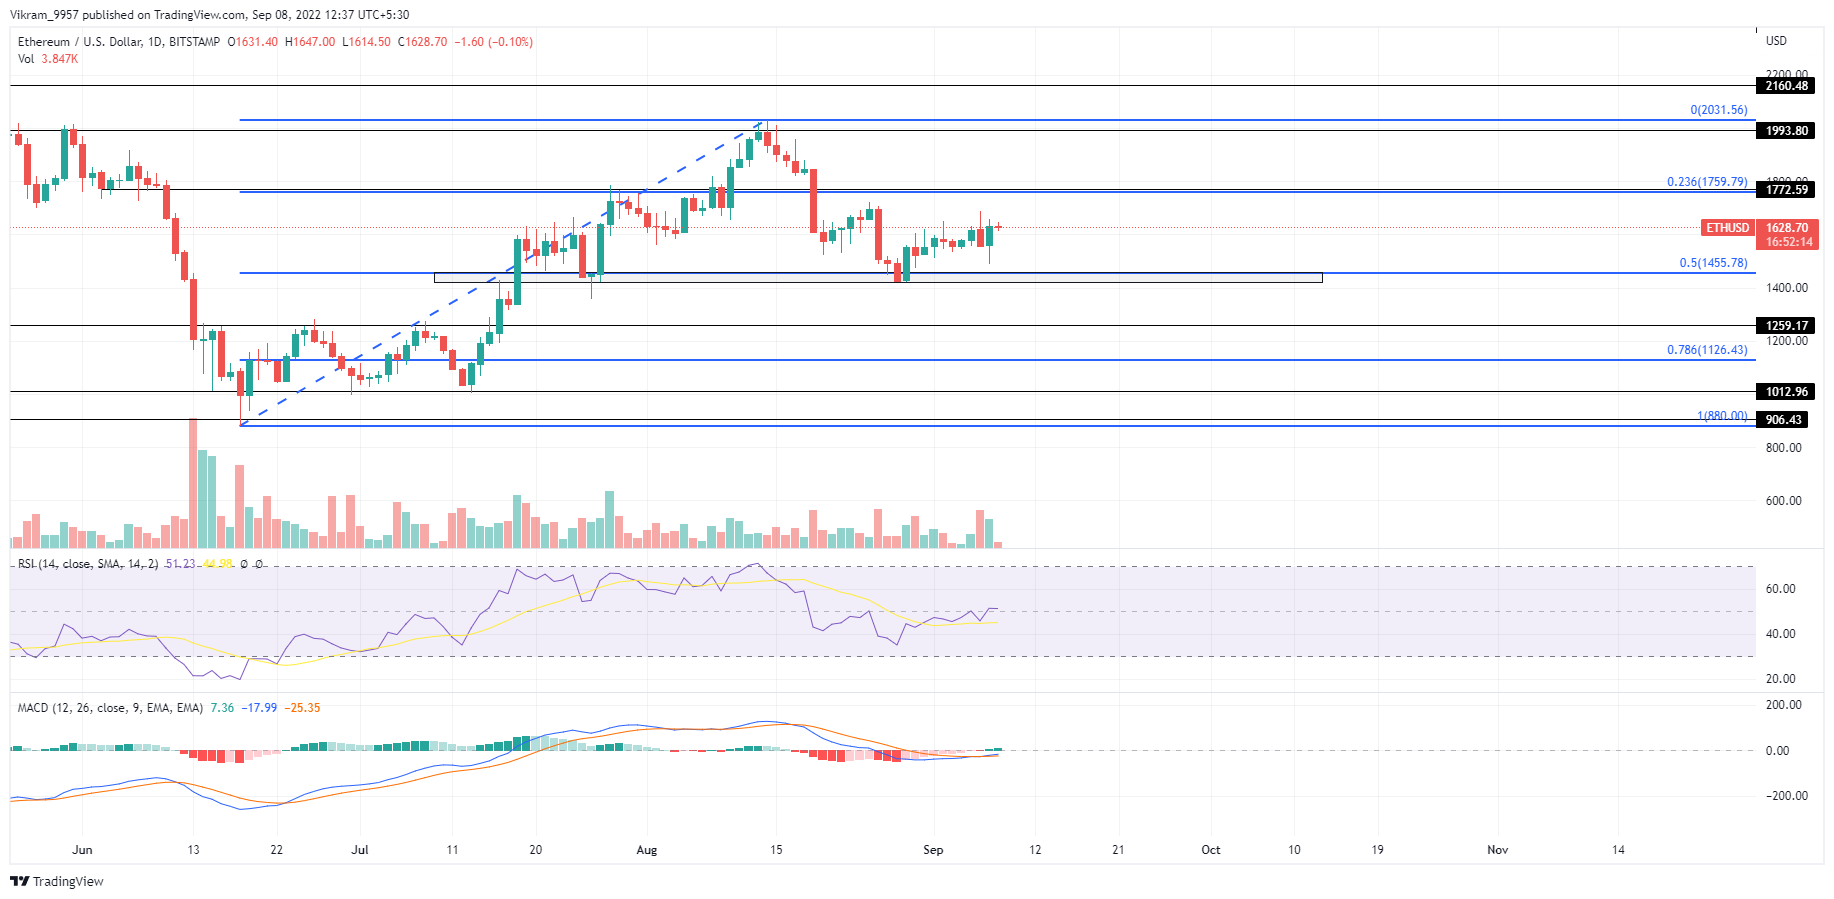
ETH price action shows a bullish growth of 7.31% within 24 hours to restore the uptrend and minimize the pressure over the $1450 support zone. The ETH prices jump by 7.31% to create a bullish engulfing candle with lower price rejection and sabotage the selling spree. The jump comes with Bitcoin stabilizing above the $18,850 mark and delaying the downtrend. So, Will the price session about the $1600 mark reach the overhead resistance of $1775?
Key Points:
- The ETH price action shows a bullish growth of 7.31%.
- The recovery rally will push Ethereum Price to the $1775 mark.
- The intraday trading volume in Ethereum is $17.62 billion.

Source — TradingView
ETH Technical Analysis
The ETH price action displays a lateral trend between the Fibonacci levels of 50% in 23.60% over the last month after the rejection from the $2000 mark. Currently, a bullish reversal from the bottom support, accounting for a price jump of 12% over the last two weeks, shows a possibility of an uptrend to the $1772 mark. Currently, the bullish reversal rally takes a lateral shift near the $1600 level, reflecting a power struggle in the daily chart. However, the recent increase in the trading volumes supporting the police engulfing candle of 7.31% jump with lower price rejection reflects an increase in demand. The Ethereum (ETH) prices will reach the overhead resistance of 23.60% Fibonacci level close to $1775 if the buying pressure sustains. Moreover, a bullish breakout will lead to a bull run to the psychological mark of $2000. However, if the market value fails to sustain above the $1455 level close to the 50% Fibonacci level, it may drop to the $1260 mark.
Technical Indicators
The daily-RSI slope displays a diagonal bullish trend struggling to cross above the halfway line reflecting an overhead bearish pressure. Moreover, the MACD and signal lines struggle to gain strength after the recent bullish crossover reflecting a power struggle opposing the bullish growth. Hence the technical indicators project the possibility of a sideways trend before the Ethereum market value reaches the overhead resistance. Resistance Levels — $1775 and $2000 Support Levels — $1500 and $1450


 Bitcoin
  Ethereum
  Tether
  USDC
USDC  TRON
TRON  Dogecoin
  Cardano
  Monero
  Bitcoin Cash
  Chainlink
  LEO Token
  Stellar
  Zcash
Zcash  Litecoin
  Hedera
  Dai
Dai  Cronos
  OKB
OKB  Tether Gold
  Ethereum Classic
  KuCoin
  Cosmos Hub
  Gate
Gate  Algorand
  VeChain
  Dash
Dash  Stacks
  Tezos
Tezos  TrueUSD
  IOTA
IOTA  Decred
  Theta Network
  Basic Attention
  NEO
NEO  Synthetix
  Qtum
Qtum  Ravencoin
  0x Protocol
  Zilliqa
  DigiByte
  Nano
Nano  Siacoin
  Numeraire
  Waves
Waves  Ontology
  Enjin Coin
  Status
  Hive
Hive  BUSD
BUSD  Lisk
Lisk  Pax Dollar
  Steem
Steem  Huobi
Huobi  OMG Network
  Bitcoin Gold
  NEM
NEM  Augur
Augur  Bitcoin Diamond