ETH Technical Analysis: Will Ethereum Prices Crash Below $1500?

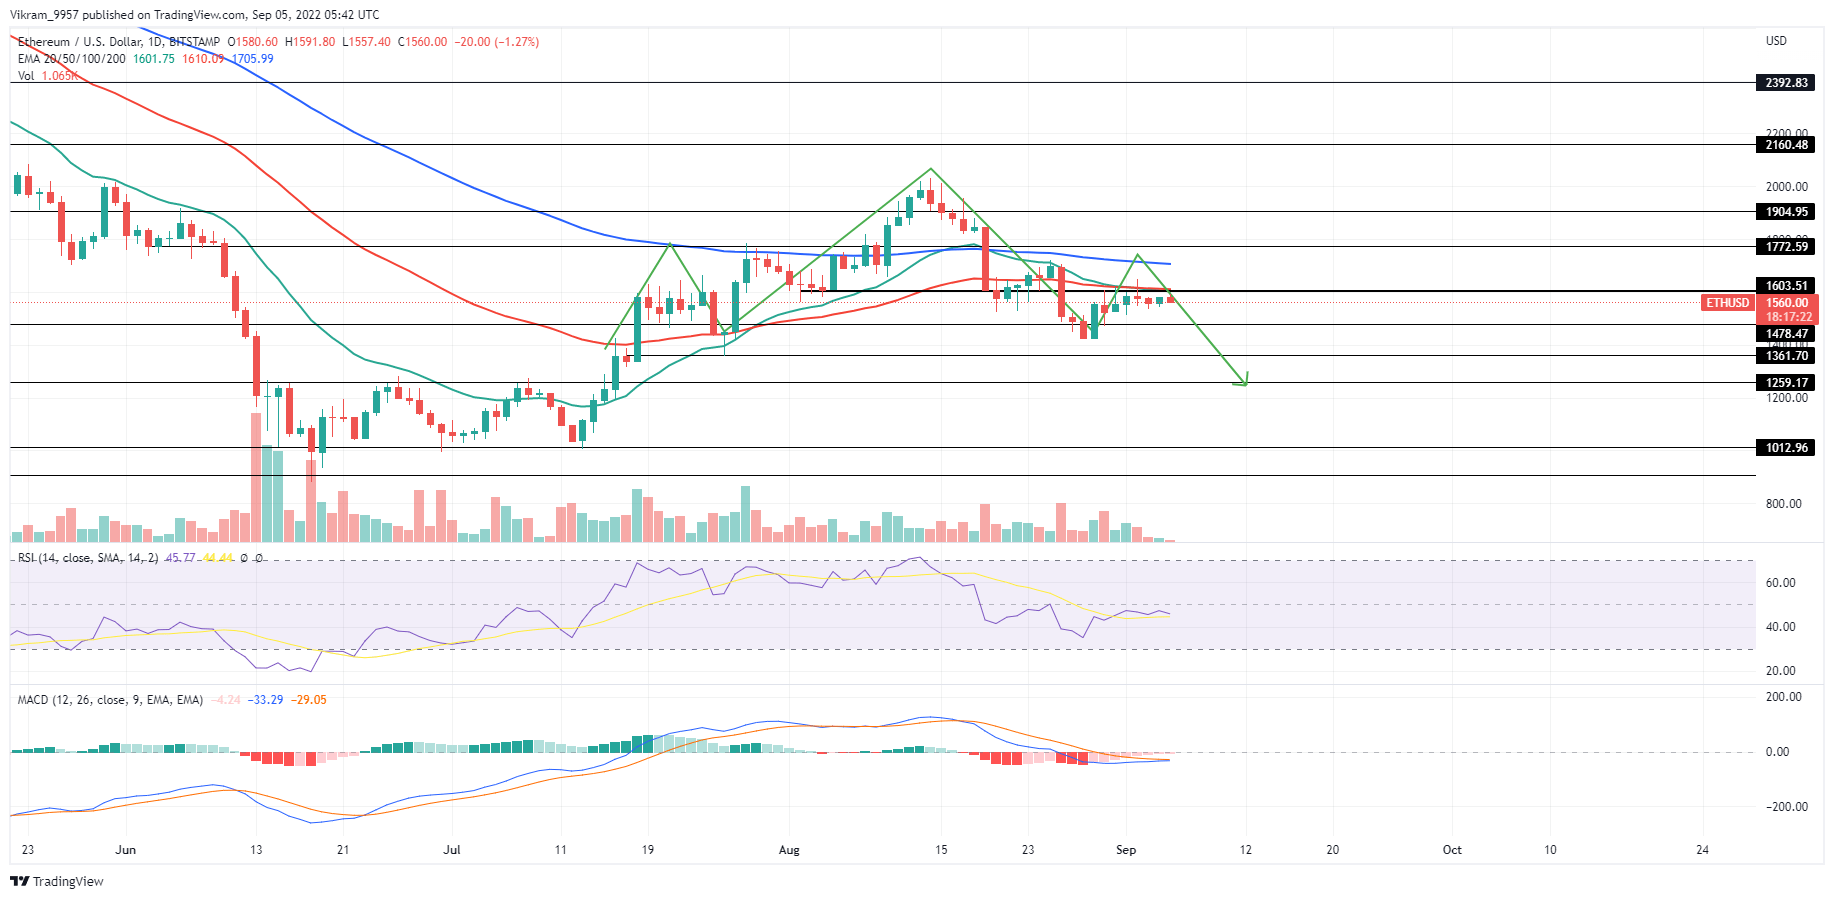
ETH price action forecasts a bleak future as the selling pressure grows, warning of a fall below the psychological mark of $1500. A negative reversal to test the buyers at the $1427 horizontal zone is more likely as the Ethereum (ETH) price struggles close to the $1600 resistance level. Additionally, a rising bearish pattern on the daily chart foreshadows a significant corrective phase in the coming days. So, should you think about taking early exits or keep making purchases above $1500?
Key Points:
- The increased selling pressure at the $1600 level results in an evening star pattern.
- The breakdown of the $1427 support level can drop ETH prices to $1259.
- The intraday trading volume in Ethereum is $9.88 billion, indicating an insignificant rise of 13%.

Source -TradingView
ETH Technical Analysis
On the daily chart, the ETH prices show a fight for control over the $1600 level of support, hinting at a likely negative move. Furthermore, the evening star pattern near the mentioned resistance level has an enhanced negative impact on the underlying sentiments. Additionally, the higher price rejection candles at the 50-day and 20-day EMAs indicate additional selling pressure under the surface. Further, the falling trading volume trend suggests a buyer’s interest decline. In the bigger image, a head and shoulder design with a neckline at the $1427 horizontal zone is developing. And given that the probable reversal would complete the bearish pattern, a significant drop in the ETH prices is possible. The price may fall to the next support level at the $1259 level on a bearish collapse of the $1427 horizontal zone. However, if bulls can maintain the price of Ethereum fluctuating around the $1427 demand zone, a sustained lateral move below $1600 is probable.
Technical Indicators
The MACD indicator shows a bullish crossover possibility projecting hope for buyers. However, the ETH prices anticipate a turnaround from the $1600 support level, and the RSI indicator replicates the bullish failure. Resistance level — $1600 and $1730 Support level — $1427 and $1259


 Bitcoin
  Ethereum
  Tether
  USDC
USDC  TRON
TRON  Dogecoin
  Cardano
  Bitcoin Cash
  Monero
  Chainlink
  LEO Token
  Stellar
  Zcash
Zcash  Litecoin
  Hedera
  Dai
Dai  Cronos
  OKB
OKB  Tether Gold
  Ethereum Classic
  KuCoin
  Cosmos Hub
  Gate
Gate  Algorand
  Dash
Dash  VeChain
  Tezos
Tezos  Stacks
  TrueUSD
  Decred
  IOTA
IOTA  Theta Network
  Basic Attention
  NEO
NEO  Synthetix
  Qtum
Qtum  0x Protocol
  Ravencoin
  Zilliqa
  DigiByte
  Nano
Nano  Siacoin
  Numeraire
  Waves
Waves  Ontology
  Enjin Coin
  Status
  BUSD
BUSD  Hive
Hive  Pax Dollar
  Lisk
Lisk  Steem
Steem  Huobi
Huobi  OMG Network
  Bitcoin Gold
  NEM
NEM