Ethereum’s Downtrend Resistance Holds Strong Despite Price Gains

This trend has been similar to that of Bitcoin, which has also seen a recent increase in price. Ethereum’s current price is around $1,850 and is trading above the 100-hourly Simple Moving Average.
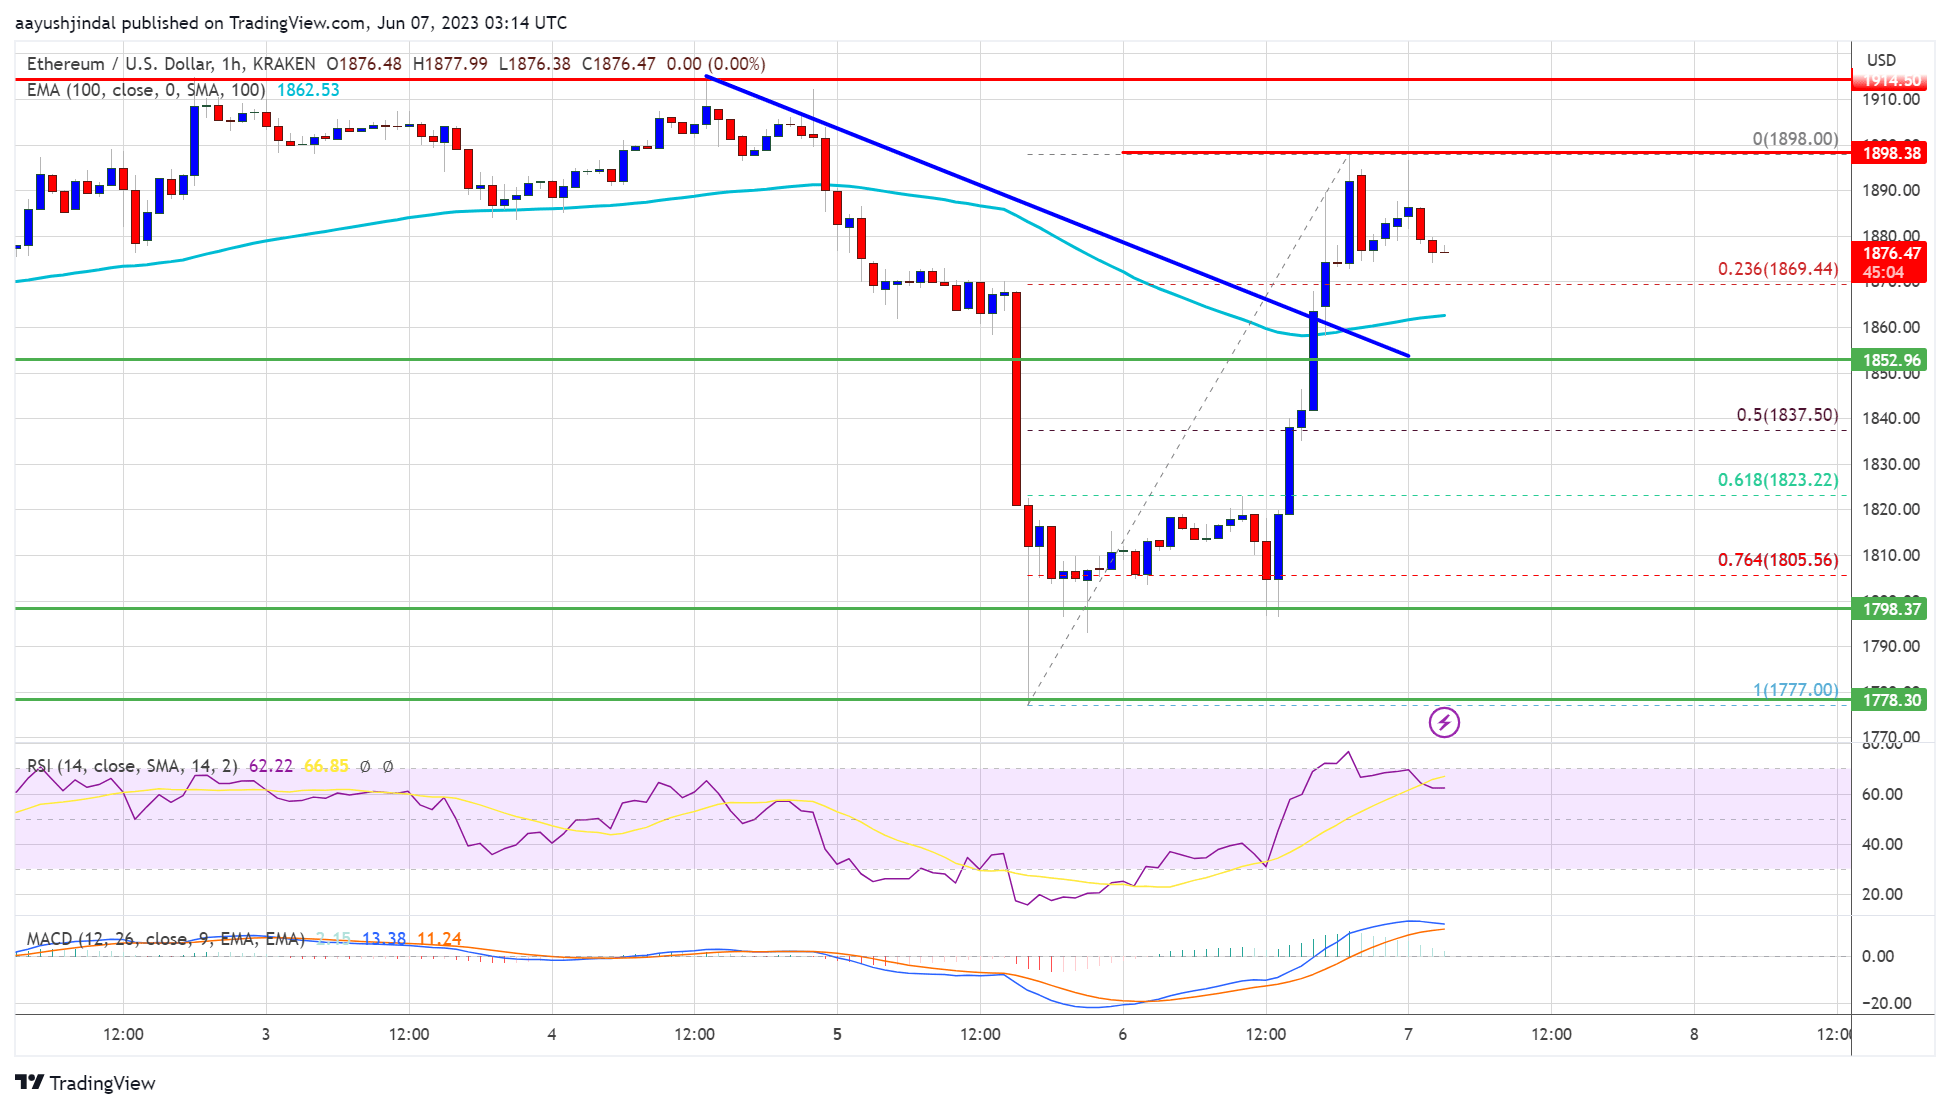
In the hourly chart of ETH/USD, there was a clear move above the $1,840 and $1,850 resistance levels. Furthermore, a key bearish trend line with resistance near $1,865 was broken, indicating a potential upward trend in the near future. The price then formed a high near $1,898 and is currently consolidating gains.

Looking ahead, immediate resistance is near the $1,900 zone, with the next major resistance near the $1,920 level. This level has been tested multiple times in the past, making it a multi-touch zone. If Ethereum makes a proper move above the $1,900 and $1,920 resistance levels, it might experience an upward trend, possibly leading to a price of $1,950. The next resistance sits near $2,000, above which Ethereum could rise further to $2,040. If the price gains continue beyond the $2,040 resistance zone, it might reach the $2,120 resistance level.
Ethereum fails to clear the $1,900 resistance, it could start another decline. Initial support on the downside is near the $1,860 level and the 100-hourly Simple Moving Average. The next major support is near the $1,840 zone or the 50% Fib retracement level of the recent increase from the $1,777 swing low to the $1,898 high. If there is a break below the $1,840 support, the price could decline toward the $1,800 support. Any further losses may perhaps send the price toward the $1,775 level or even $1,740 in the coming sessions.
DISCLAIMER: The Information on this website is provided as general market commentary and does not constitute investment advice. We encourage you to do your own research before investing.


 Bitcoin
  Ethereum
  Tether
  USDC
USDC  TRON
TRON  Dogecoin
  Cardano
  Bitcoin Cash
  Monero
  Chainlink
  LEO Token
  Stellar
  Zcash
Zcash  Litecoin
  Hedera
  Dai
Dai  Cronos
  OKB
OKB  Tether Gold
  Ethereum Classic
  KuCoin
  Cosmos Hub
  Gate
Gate  Algorand
  Dash
Dash  VeChain
  Tezos
Tezos  Stacks
  TrueUSD
  Decred
  IOTA
IOTA  Theta Network
  Basic Attention
  NEO
NEO  Synthetix
  Qtum
Qtum  0x Protocol
  Ravencoin
  Zilliqa
  DigiByte
  Nano
Nano  Siacoin
  Holo
Holo  Numeraire
  Waves
Waves  Enjin Coin
  Ontology
  Status
  BUSD
BUSD  Hive
Hive  Pax Dollar
  Lisk
Lisk  Steem
Steem  Huobi
Huobi  OMG Network
  Bitcoin Gold
  NEM
NEM  Augur
Augur