


Polkadot price analysis: DOT value upgrades to $7.44 after an upturn

The Polkadot price analysis reveals that the buyers are leading the price action, as the bulls have returned in the last 24 hours. The price is on its way towards revival and has recovered up to the $7.44 mark during the day. For the past week, the overall market trends have been in bearish support as the price levels decreased on a regular basis, but currently, the circumstances are seemingly transforming. Further recovery is possible if the buyers remain persistent with their efforts.
DOT/USD 1-day price chart: Bullish return launches price at $7.44
The 1-day Polkadot price analysis shows signs of a slight recovery in coin value, as the price curve took an upturn in the last 8-hours. This is being confirmed by the improvement in price, as it is now standing at a $7.44 lower high. In the prior weeks, the bears remained at the leading position, but today, the buyers changed a bit. The price is still quite low if we compare it to its moving average (MA) value of $8.51.
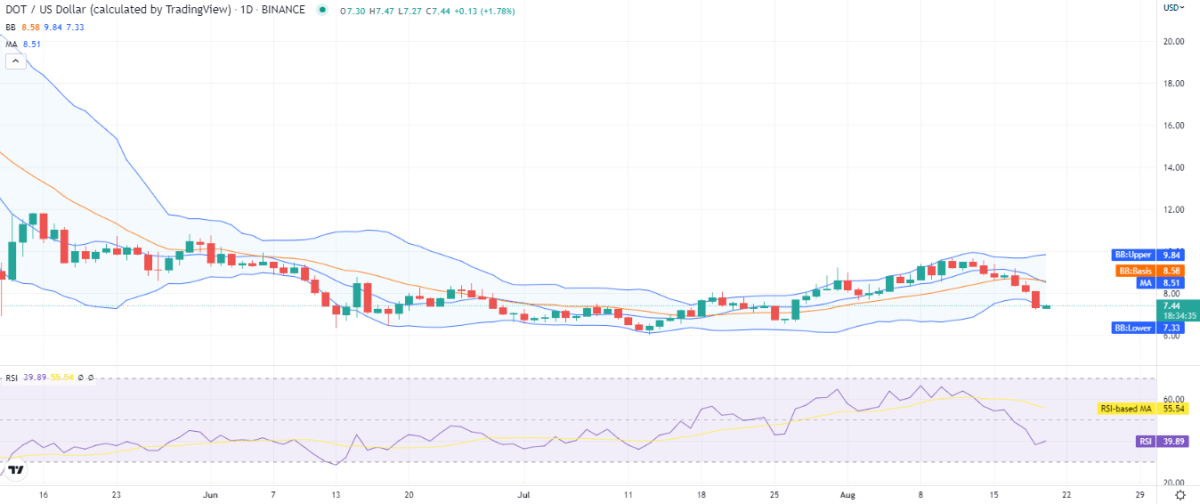
DOT/USD 1-day price chart. Source: TradingView
The Bollinger bands are diverging, which is a clear indication of the increase in volatility, and the price deviations from the current level remain high for the next few days. The upper Bollinger band is now at the $9.84 level, representing the strongest resistance and the lower Bollinger band is at $7.33, representing the strongest possible support. The Relative Strength Index (RSI) graph has also taken a turn upwards, and the score has increased to index 39 because of the bullish trend.
Polkadot price analysis: Recent developments and further technical indications
The 4-hour price chart for Polkadot price analysis shows an increasing trend in the market as bulls have made a successful return. The price of DOT/USD is recovering, as it rose to a $7.45 lower high just recently. The last four hours yet again proved favorable for the cryptocurrency buyers, and the green candlesticks are noticeably dominating the price chart for today’s trading session. If we move towards the moving average indicator, it shows a $7.57 reading.
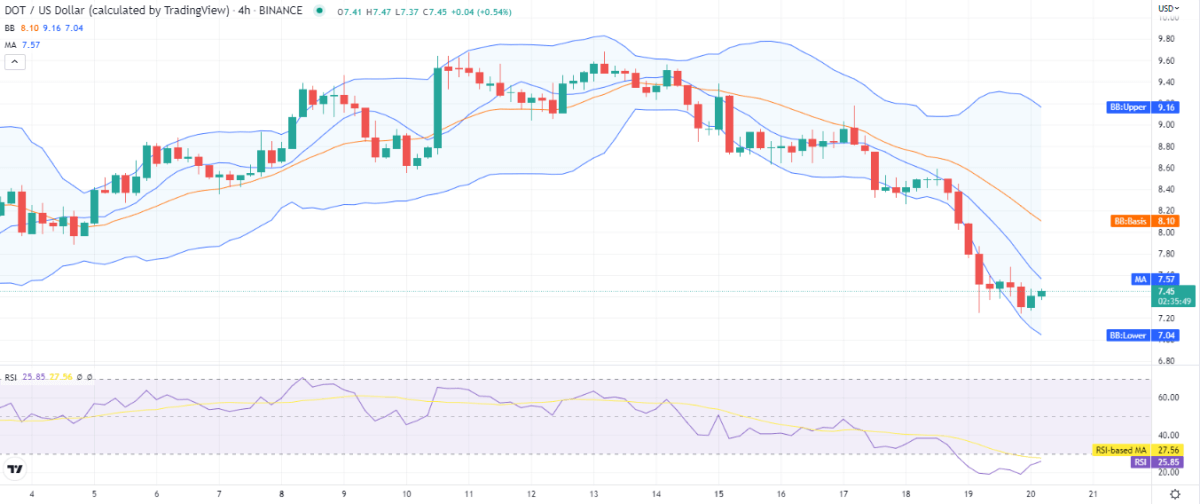
DOT/USD 4-hours price chart. Source: TradingView
The volatility is high on the 4-hour chart. The Bollinger bands Indicator shows us the following values; the upper band is trading at $9.16, whereas the lower band is at $7.04. The RSI curve has ascended to index 25 and is expected to cross into the neutral range if the buying momentum continues; however, the indicator is still trading in the underbought zone.
Polkadot price analysis conclusion
The Polkadot price analysis shows a rising possibility of an upturn in price. The bullish momentum gained stability in the past 8-hours, as the price stepped up to $7.45. Further improvement is to follow if the buyers show consistency with their efforts. The hourly price chart shows an increasing number of green candlesticks, a further indication of an upward trend.
Disclaimer. The information provided is not trading advice. Cryptopolitan.com holds no liability for any investments made based on the information provided on this page. We strongly recommend independent research and/or consultation with a qualified professional before making any investment decisions.


 Bitcoin
  Ethereum
  Tether
  USDC
USDC  Dogecoin
  Cardano
  Bitcoin Cash
  Polygon
  Litecoin
  LEO Token
  Hedera
  Cosmos Hub
  Stellar
  OKB
OKB  Maker
Maker  Algorand
  NEO
NEO  Gate
Gate  KuCoin
  Synthetix Network
  IOTA
IOTA  Tether Gold
  Enjin Coin
  TrueUSD
  0x Protocol
  Ravencoin
  Holo
Holo  Zcash
Zcash  Siacoin
  Basic Attention
  Decred
  Ontology
  Waves
Waves  Lisk
Lisk  DigiByte
  Numeraire
  Nano
Nano  Pax Dollar
  Status
  Steem
Steem  OMG Network
  Ren
Ren  BUSD
BUSD  Bytom
Bytom  Bitcoin Diamond
  Augur
Augur  Energi
  HUSD
HUSD