What’s Driving Growth for the Ethereum (ETH) Price?

The Ethereum (ETH) price rally has stalled since the yearly high on April 14. Despite the drop, there are no clear signs of weakness yet.
The news behind the ETH price movement are still positive. The Shapella upgrade raised some concerns since it allowed users to unstake their ETH tokens. However, deposits are still outpacing withdrawals.
Will this help the ongoing ETH upward movement?
ETH Price Approaches Long-Term Resistance
ETH is a digital currency that runs on the Ethereum blockchain, developed by Vitalik Buterin. Its main focus is on decentralized applications and smart contracts. The value of ETH has been rapidly increasing since March 10.
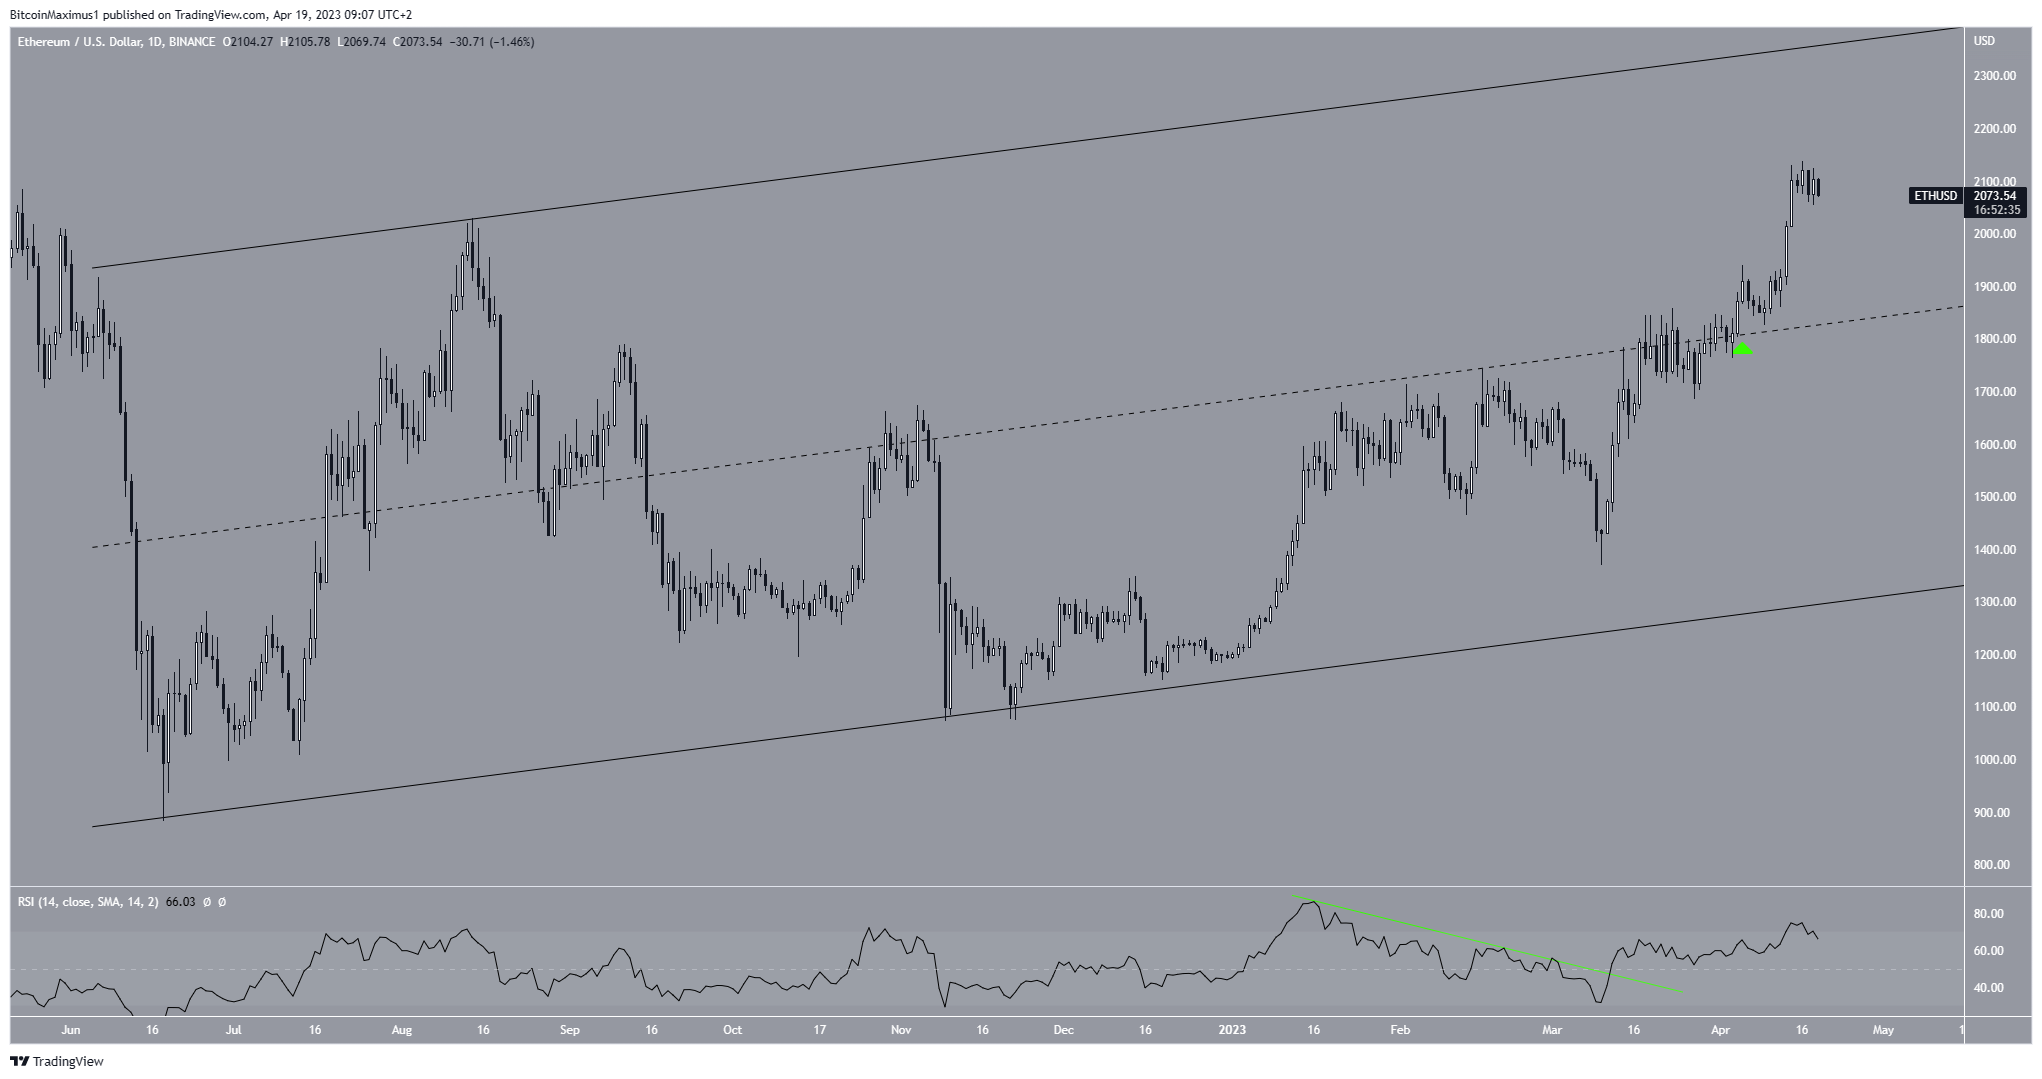
The daily Relative Strength Index (RSI) shows positive signs, supporting the price increase. The indicator broke out from a bearish divergence trendline (green line) before the increase and now sits above 70, indicating a bullish trend.

ETH/USD Daily Chart. Source: TradingView
The RSI is a momentum indicator used to determine overbought or oversold conditions. An upward trend and a reading above 50 suggest that bulls still have strength on their side. While the reading above 70 is considered overbought, no new bearish divergence exists. Therefore, the price increase is still supported by an increase in momentum.
On April 2, the price moved above the middle (green icon) of an ascending parallel channel that has been in place since June 2022. The ascending channel is a pattern that contains price movements. Both its resistance and support lines are likely to be touched numerous times.
Since the price has moved above its midline, increasing to its resistance line is the most likely scenario. The RSI also supports this.
The channel’s resistance line is currently near $2,350. This scenario remains valid as long as the ETH price does not close below the channel’s midline at an average price of $1,900.
Ethereum Price Prediction: When Will Price Reach a Top?
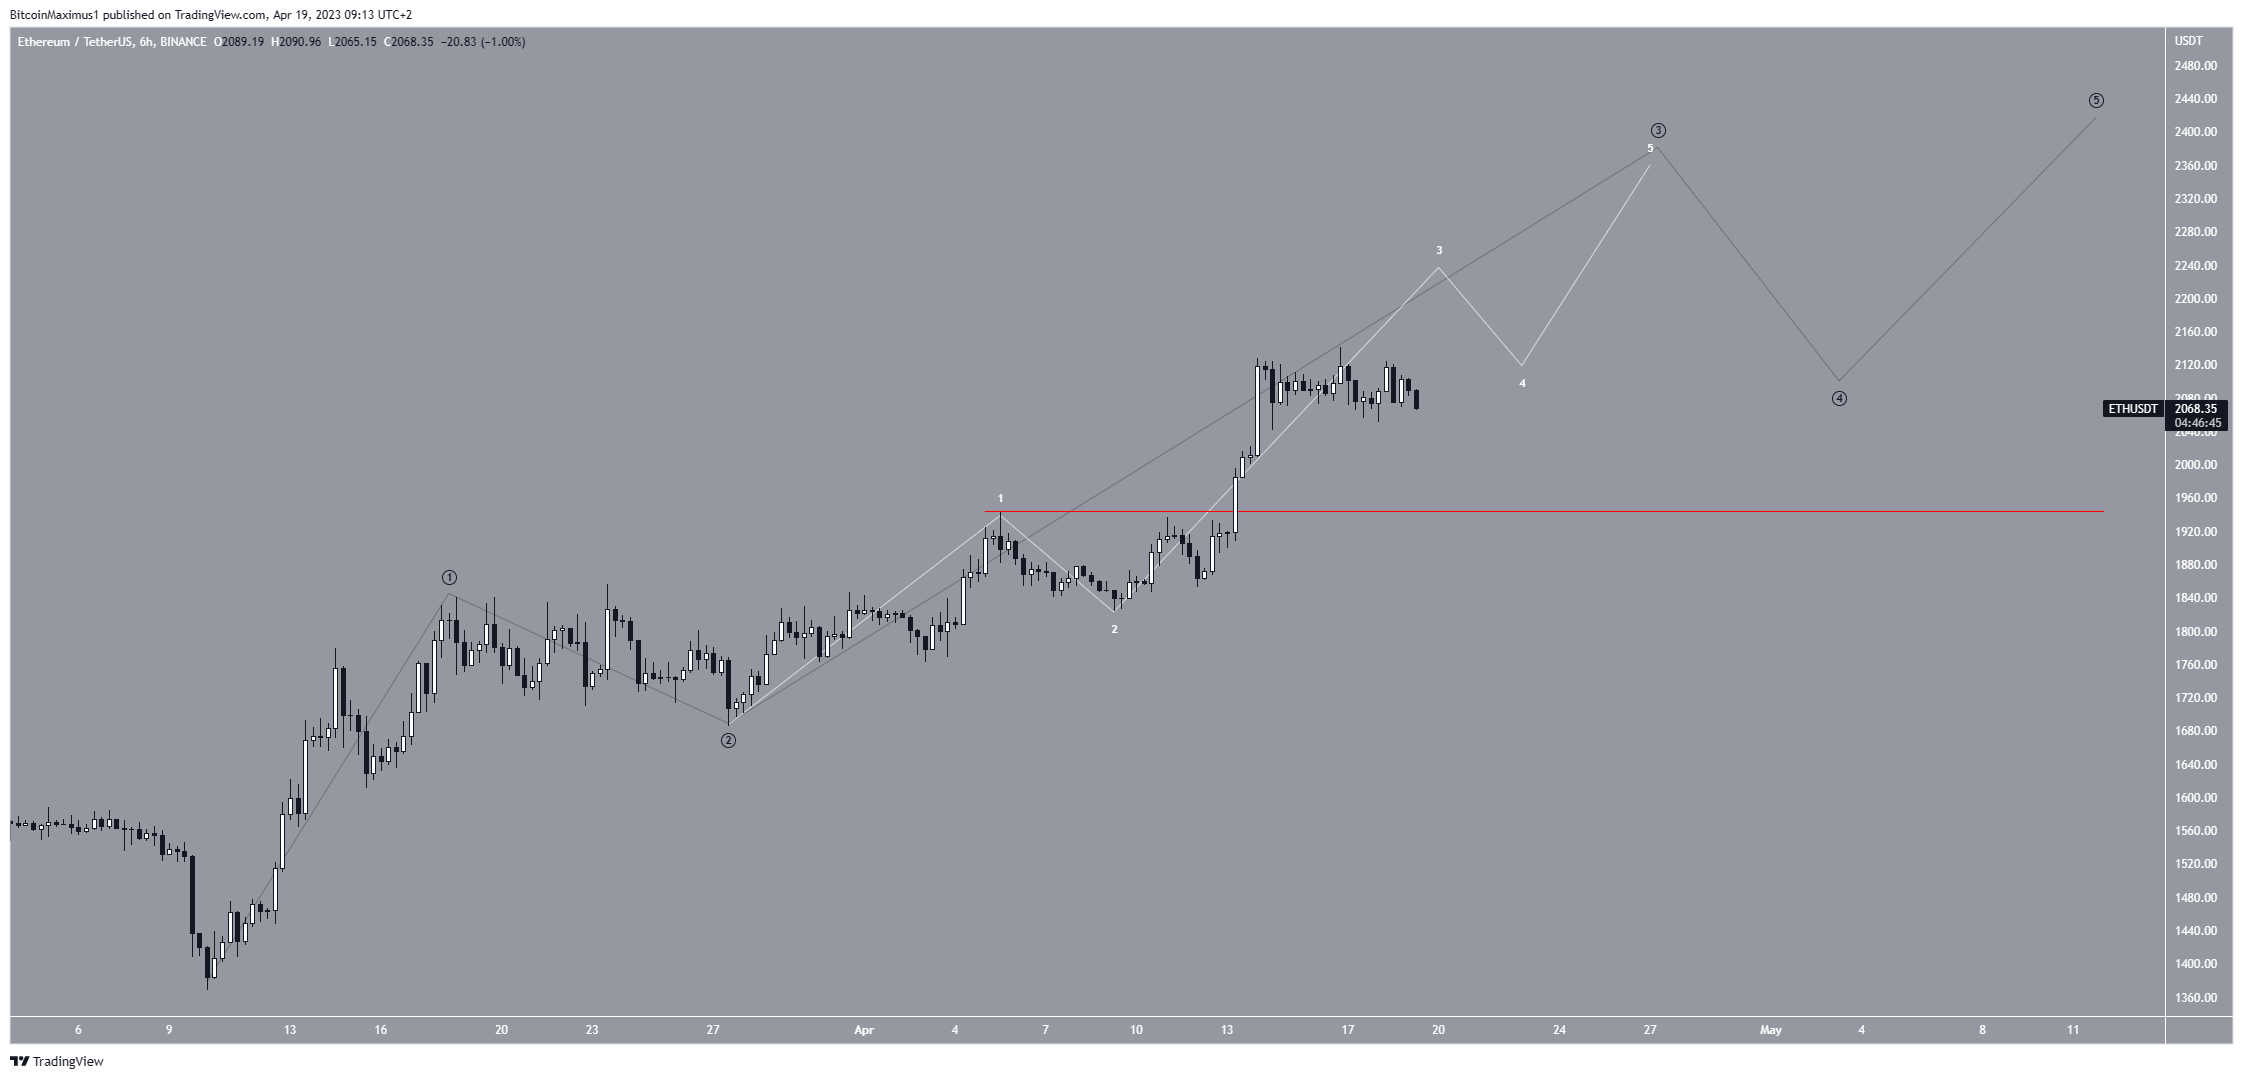
The technical analysis from the short-term six-hour time frame supports the ongoing increase. This is especially visible when looking at the wave count.
The count suggests that ETH is in wave three (black) of a five-wave upward movement. This is usually the sharpest of the bullish waves. The sub-wave count is given in white, indicating that ETH is in sub-wave three.
The wave count suggests that the ETH price will increase toward the channel’s resistance line, aligning with the RSI.

ETH/USD Six-Hour Chart. Source: TradingView
Elliott Wave theory is a tool used by technical analysts. It looks for repeating long-term price patterns and investor psychology in order to determine the trend’s direction.
To conclude, the most likely ETH price forecast is an increase toward the $2,400 resistance region. However, this bullish outlook would be invalidated by a decrease below the sub-wave one high at $1,950 (red line). This is because wave four cannot drop into wave one territory. If that occurs, the bullish count will be invalidated and the Ethereum price could fall to the long-term support line at $1,400.
For BeInCrypto’s latest crypto market analysis, click here.


 Bitcoin
  Ethereum
  Tether
  USDC
USDC  TRON
TRON  Dogecoin
  Cardano
  Bitcoin Cash
  Monero
  Chainlink
  LEO Token
  Stellar
  Zcash
Zcash  Litecoin
  Hedera
  Dai
Dai  Cronos
  Tether Gold
  OKB
OKB  Ethereum Classic
  KuCoin
  Gate
Gate  Cosmos Hub
  Algorand
  Dash
Dash  VeChain
  Tezos
Tezos  Stacks
  TrueUSD
  Decred
  IOTA
IOTA  Theta Network
  Basic Attention
  NEO
NEO  Synthetix
  Qtum
Qtum  DigiByte
  0x Protocol
  Ravencoin
  Zilliqa
  Nano
Nano  Siacoin
  Numeraire
  Waves
Waves  Enjin Coin
  Ontology
  Status
  BUSD
BUSD  Hive
Hive  Pax Dollar
  Lisk
Lisk  Steem
Steem  Huobi
Huobi  OMG Network
  Bitcoin Gold
  NEM
NEM  Augur
Augur