BTC Below $16,880 Support; Will It Follow a Positive Traction?

Although Bitcoin (BTC) and other major coins nosedived due to the FTX collapse in November, some price predictions hold the optimism that BTC will reach $250,000 in 2023.
In a CNBC program, Tim Draper, founder of Draper Venture Network, recently forecasted that BTC will reach $250K in the next year, despite FTX’s collapse. However, this prediction is impossible in the eyes of other analysts, as BTC is not even above $60,000.

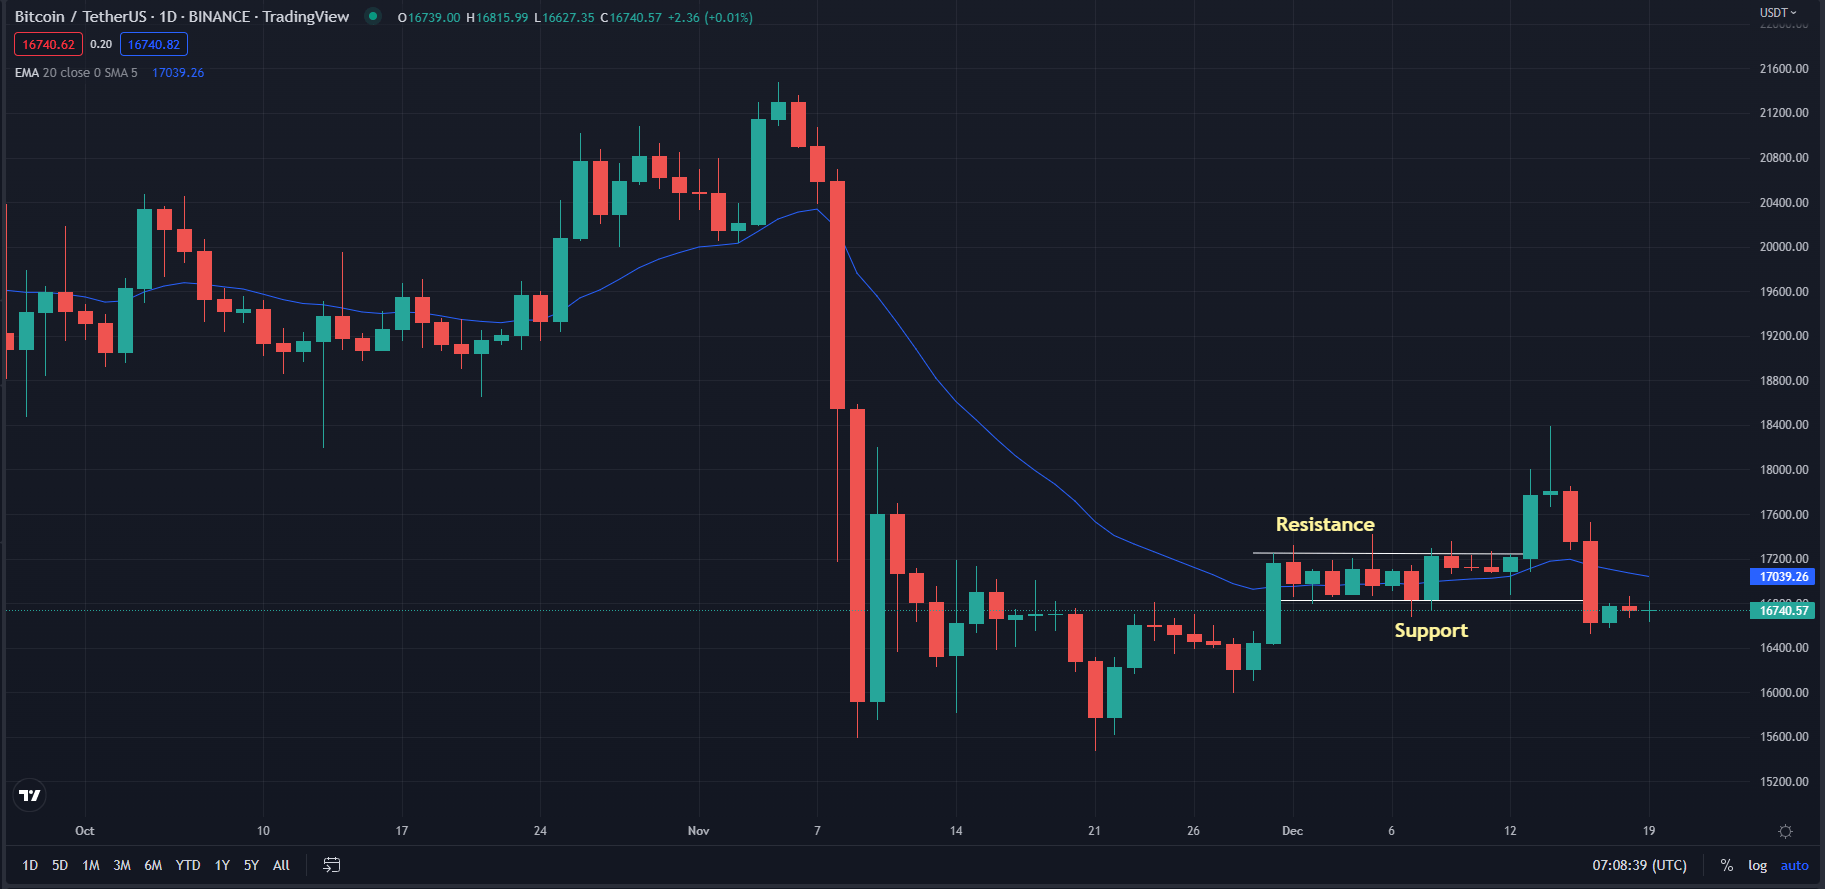
BTC/USDT- 1-Day Trading Chart (Source: TradingView)
As of this writing, BTC exchanged hands at $16,715, a 0.28% dip in the past 24 hours. The 1-day trading chart of BTC signifies that the coin is just below the $16,880 shortest support zone.
If BTC breaks this support zone in intraday trading, it can reach back to its previous resistance of $17,100 in the following days. Notably, after a uniform price movement since the end of November, BTC spiked to $18,388 on December 14 due to the FOMC meeting.
Adding on, 20-day EMA shows that the candle is near the EMA line, but the chances for the price to hit the line are less in intraday trading.

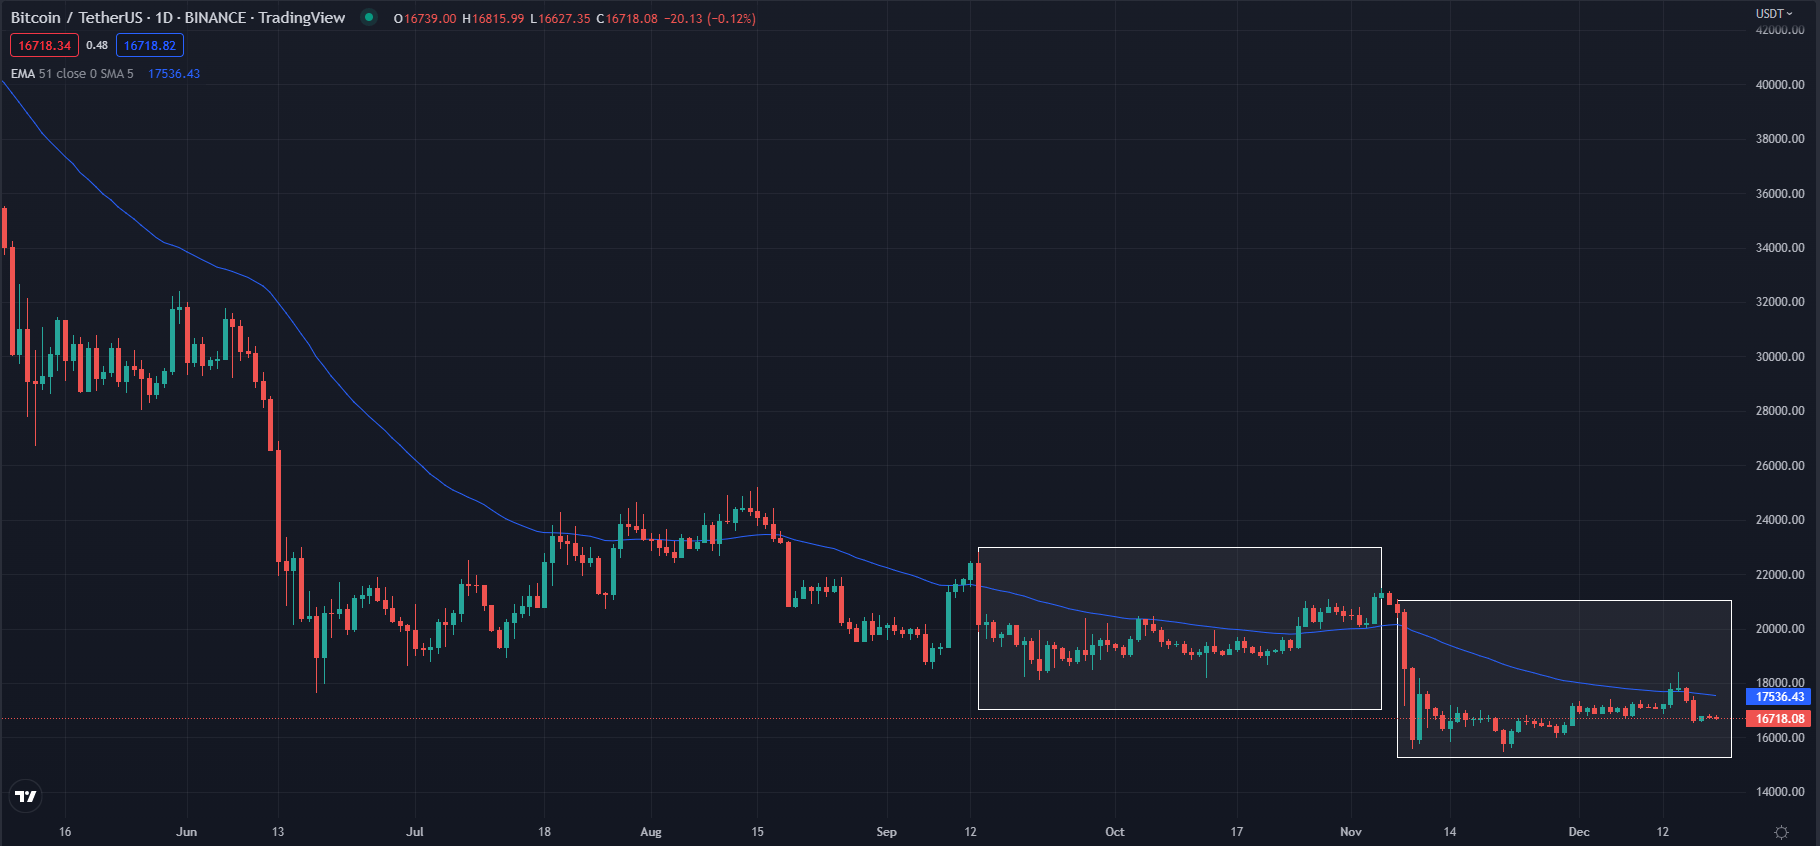
BTC/USDT- 1-Day Trading Chart (Source: TradingView)
From another viewpoint, BTC retraces the same pattern of the September 13 – November 5 time frame. In this regard, there would be a slight surge in the coming days.
Significantly, the upcoming economic events such as IFO Business Climate Index and CBI Industrial Trends would also contribute to the future price trends of BTC and other coins.
Disclaimer: The views and opinions, as well as all the information shared in this price analysis, are published in good faith. Readers must do their own research and due diligence. Any action taken by the reader is strictly at their own risk. Coin Edition and its affiliates will not be held liable for any direct or indirect damage or loss.


 Bitcoin
  Ethereum
  Tether
  USDC
USDC  TRON
TRON  Dogecoin
  Cardano
  Bitcoin Cash
  Chainlink
  Monero
  LEO Token
  Stellar
  Zcash
Zcash  Litecoin
  Hedera
  Dai
Dai  Cronos
  Tether Gold
  OKB
OKB  Ethereum Classic
  KuCoin
  Gate
Gate  Algorand
  Cosmos Hub
  VeChain
  TrueUSD
  Dash
Dash  Tezos
Tezos  Stacks
  IOTA
IOTA  Basic Attention
  Theta Network
  NEO
NEO  Decred
  Synthetix
  Qtum
Qtum  Ravencoin
  DigiByte
  0x Protocol
  Nano
Nano  Zilliqa
  Siacoin
  Numeraire
  Waves
Waves  BUSD
BUSD  Status
  Pax Dollar
  Enjin Coin
  Ontology
  Hive
Hive  Lisk
Lisk  Steem
Steem  Huobi
Huobi  OMG Network
  NEM
NEM  Bitcoin Gold
  Augur
Augur  HUSD
HUSD  Ren
Ren