


Bitcoin Price Analysis: Bears Reach 27605 — 9 May 2023
BTC/USD Bears Reach 27605: Sally Ho’s Technical Analysis – 9 May 2023
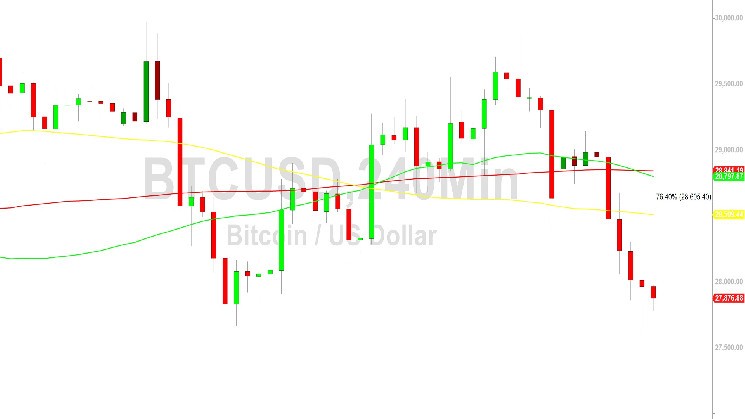
Bitcoin (BTC/USD) continued to experience strong negative momentum early in the Asian session as the pair traded below the 28000 figure after Stops were elected below the 28059.16 level, a downside price objective associated with selling pressure that emerged around the 29850 and 29466.76 levels. Traders pushed BTC/USD as low as the 27605.23 area during the depreciation, representing a test of a previous upside price objective associated with buying pressure that strengthened around the 27194.51 area. Significant buying and selling activity recently took place around the 29298.31 area during the depreciation, an upside price objective linked to buying pressure that increased around the 28122 area.
Above the market, upside price objectives relate to recent buying pressure around the 27194.51 and 28161.74 areas include the 30420.74, 31237.11, and 32556.73 levels. Downside price objectives related to recent depreciating ranges and levels include the 26533, 26085, 25604, and 24103 levels. Additional upside price objectives include the 31477.37, 32501.23, 32989.19, 34583.96, 34658.69, 35222.66, 37765.28, and 38403.97 levels. Another important price objective is the 31846.88 area, a level that represents the 50% retracement of the depreciating range from 48233.76 to 15460. Traders are observing that the 50-bar MA (4-hourly) is bullishly indicating above the 100-bar MA (4-hourly) and above the 200-bar MA (4-hourly). Also, the 50-bar MA (hourly) is bullishlly indicating above the 100-bar MA (hourly) and above the 200-bar MA (hourly).
Price activity is nearest the 50-bar MA (4-hourly) at 28924.21 and the 200-bar MA (Hourly) at 28933.63.
Technical Support is expected around 26533.04/ 25604.51/ 25094.62 with Stops expected below.
Technical Resistance is expected around 31986.16/ 32989.19/ 34658.69 with Stops expected above.
On 4-Hourly chart, SlowK is Bullishly above SlowD while MACD is Bearishly below MACDAverage.
On 60-minute chart, SlowK is Bullishly above SlowD while MACD is Bullishly above MACDAverage.
Disclaimer: Sally Ho’s Technical Analysis is provided by a third party, and for informational purposes only. It does not reflect the views of Crypto Daily, nor is it intended to be used as legal, tax, investment, or financial advice.


 Bitcoin
  Ethereum
  Tether
  Dogecoin
  USDC
USDC  Cardano
  Stellar
  Hedera
  Bitcoin Cash
  LEO Token
  Litecoin
  Algorand
  OKB
OKB  Cosmos Hub
  Gate
Gate  Maker
Maker  KuCoin
  IOTA
IOTA  NEO
NEO  Polygon
  Zcash
Zcash  Synthetix Network
  Tether Gold
  TrueUSD
  Holo
Holo  Enjin Coin
  0x Protocol
  Basic Attention
  Siacoin
  Ravencoin
  Decred
  Ontology
  DigiByte
  Nano
Nano  Status
  Waves
Waves  Numeraire
  Steem
Steem  Pax Dollar
  BUSD
BUSD  OMG Network
  Ren
Ren  Bitcoin Diamond
  Bytom
Bytom