


Bitcoin (BTC) Price Analysis for January 19
The correction might not have ended yet, according to the CoinMarketCap ranking.
BTC/USD
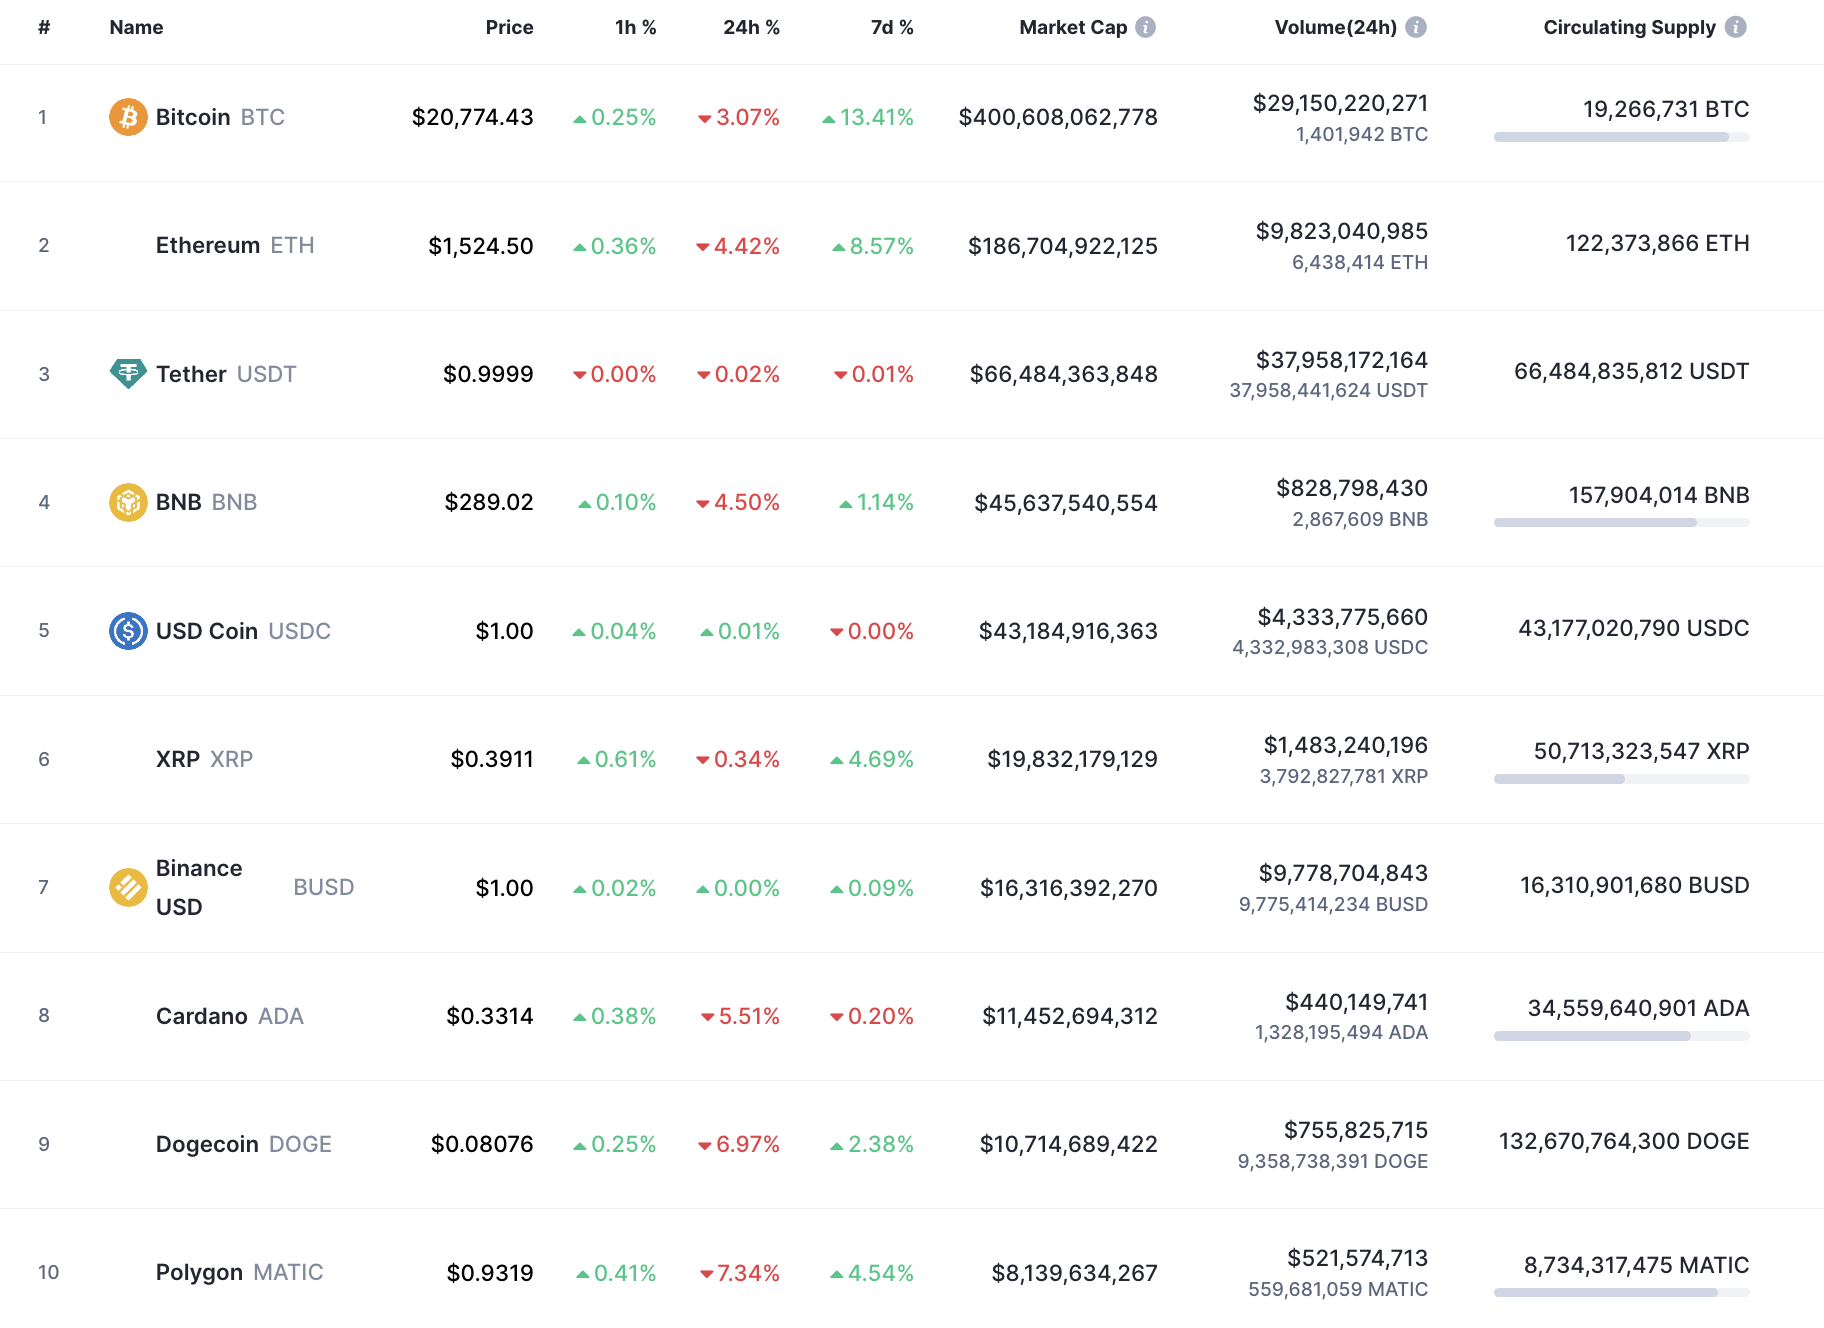
The rate of Bitcoin (BTC) has declined by 3% since yesterday.
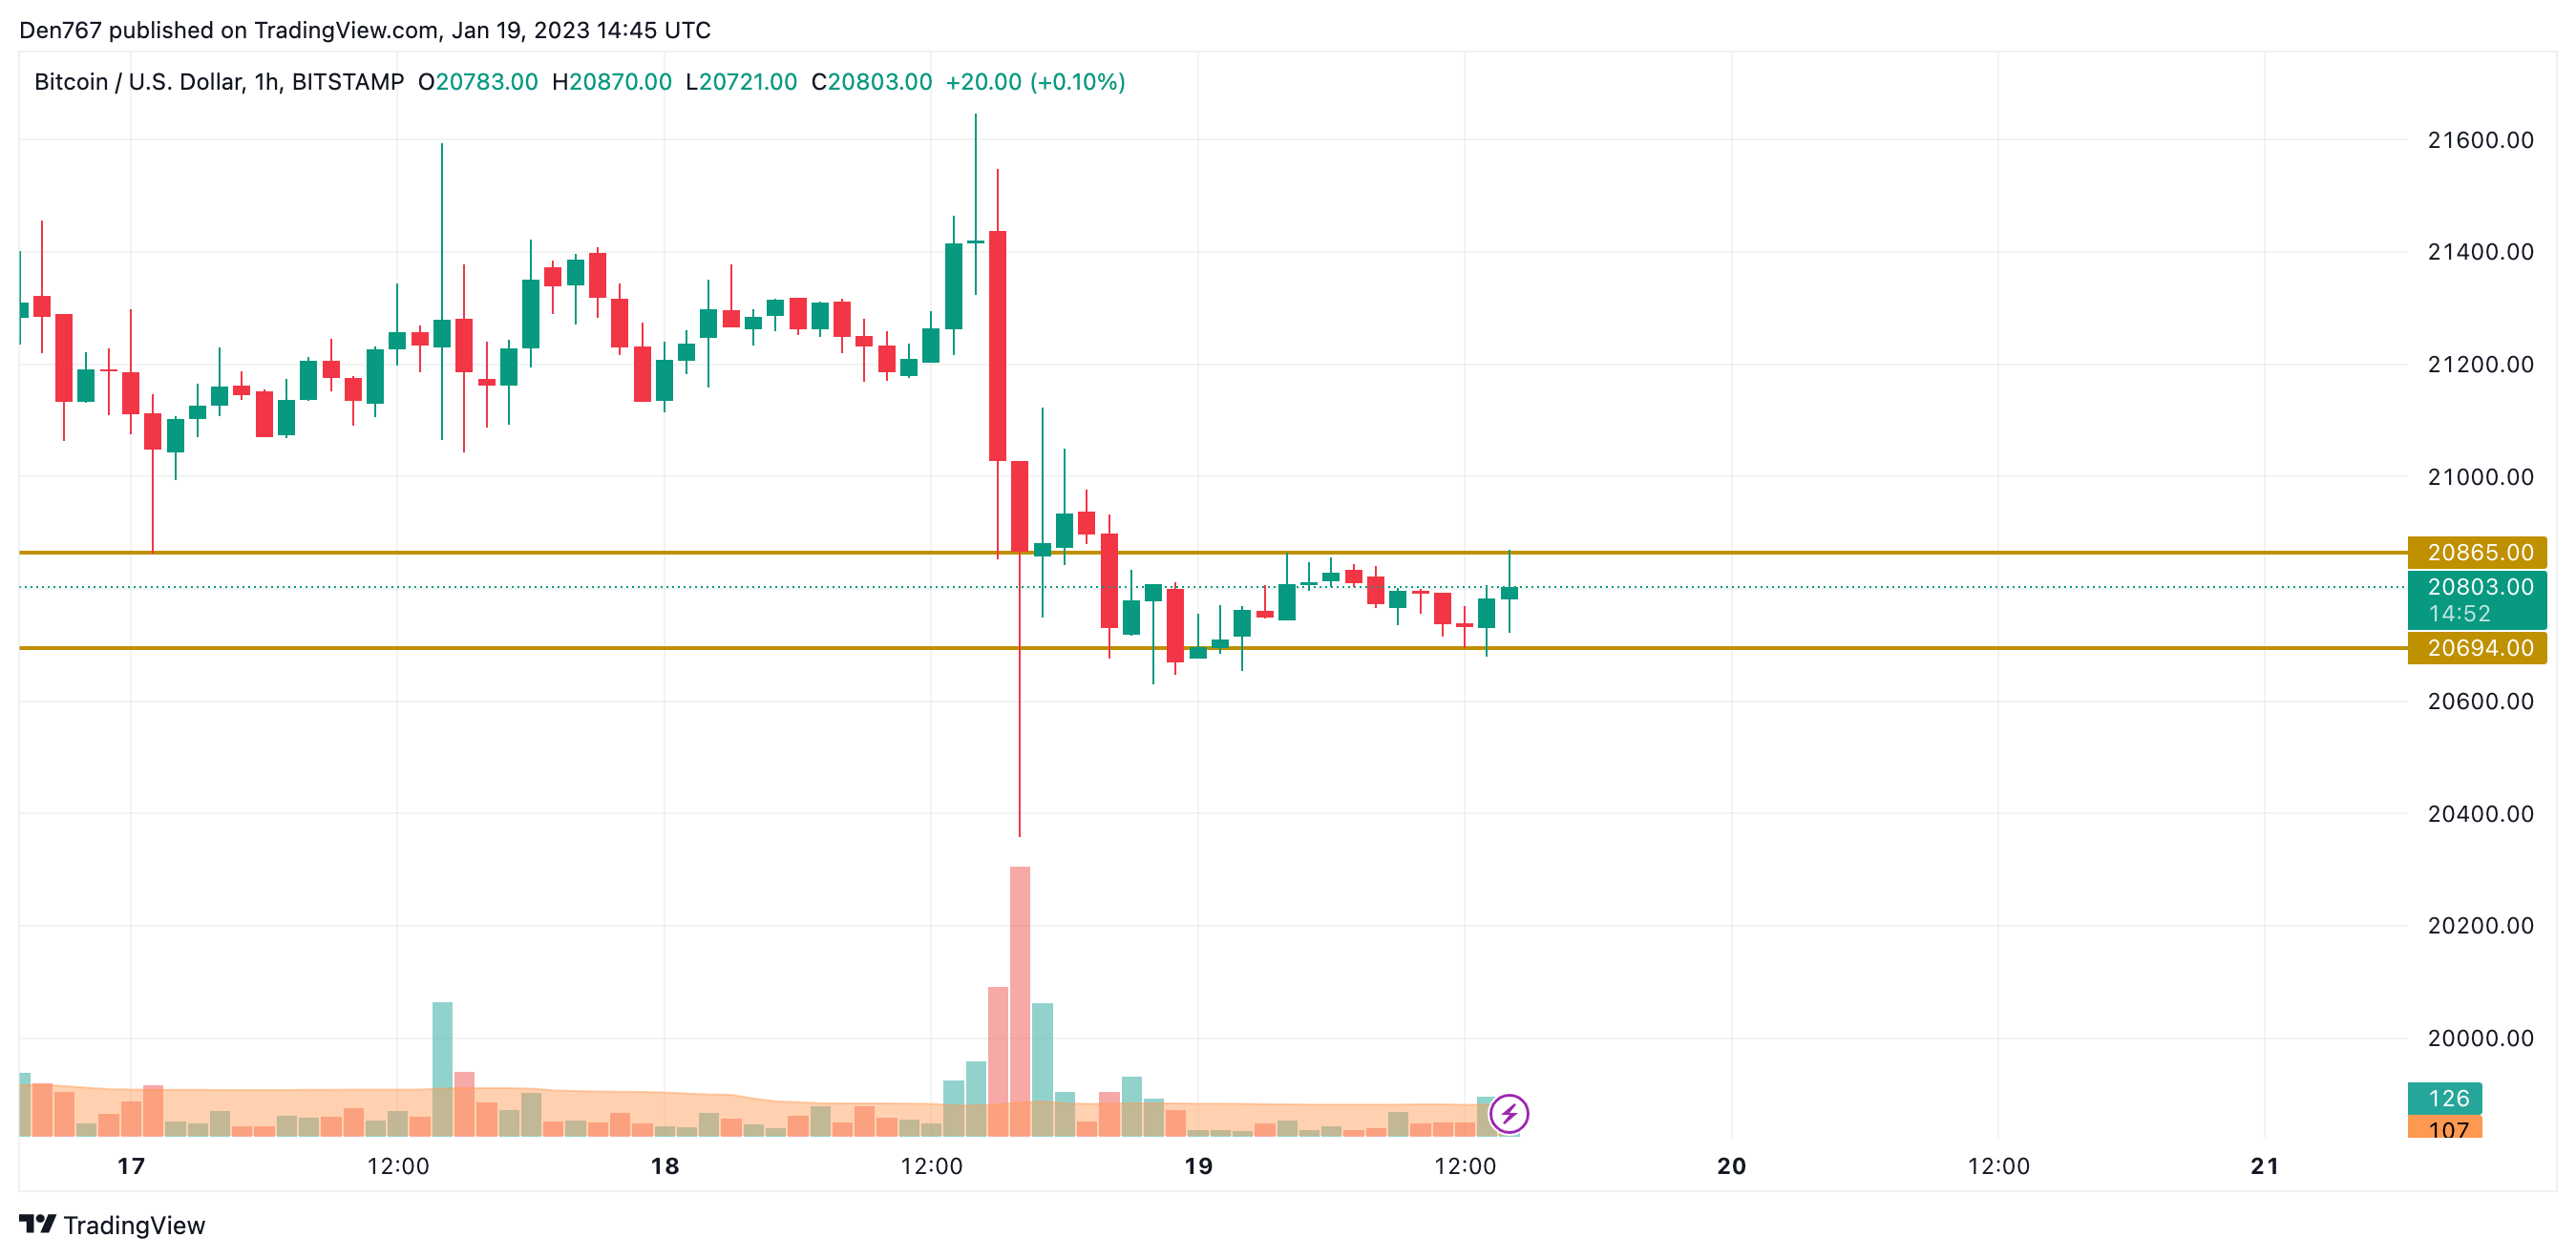
On the hourly chart, the price of Bitcoin (BTC) is trading in a narrow range between the support at $20,694 and the resistance at $20,865. If the daily bar closes near the upper line, the breakout may lead to the growth of $21,000 tomorrow.
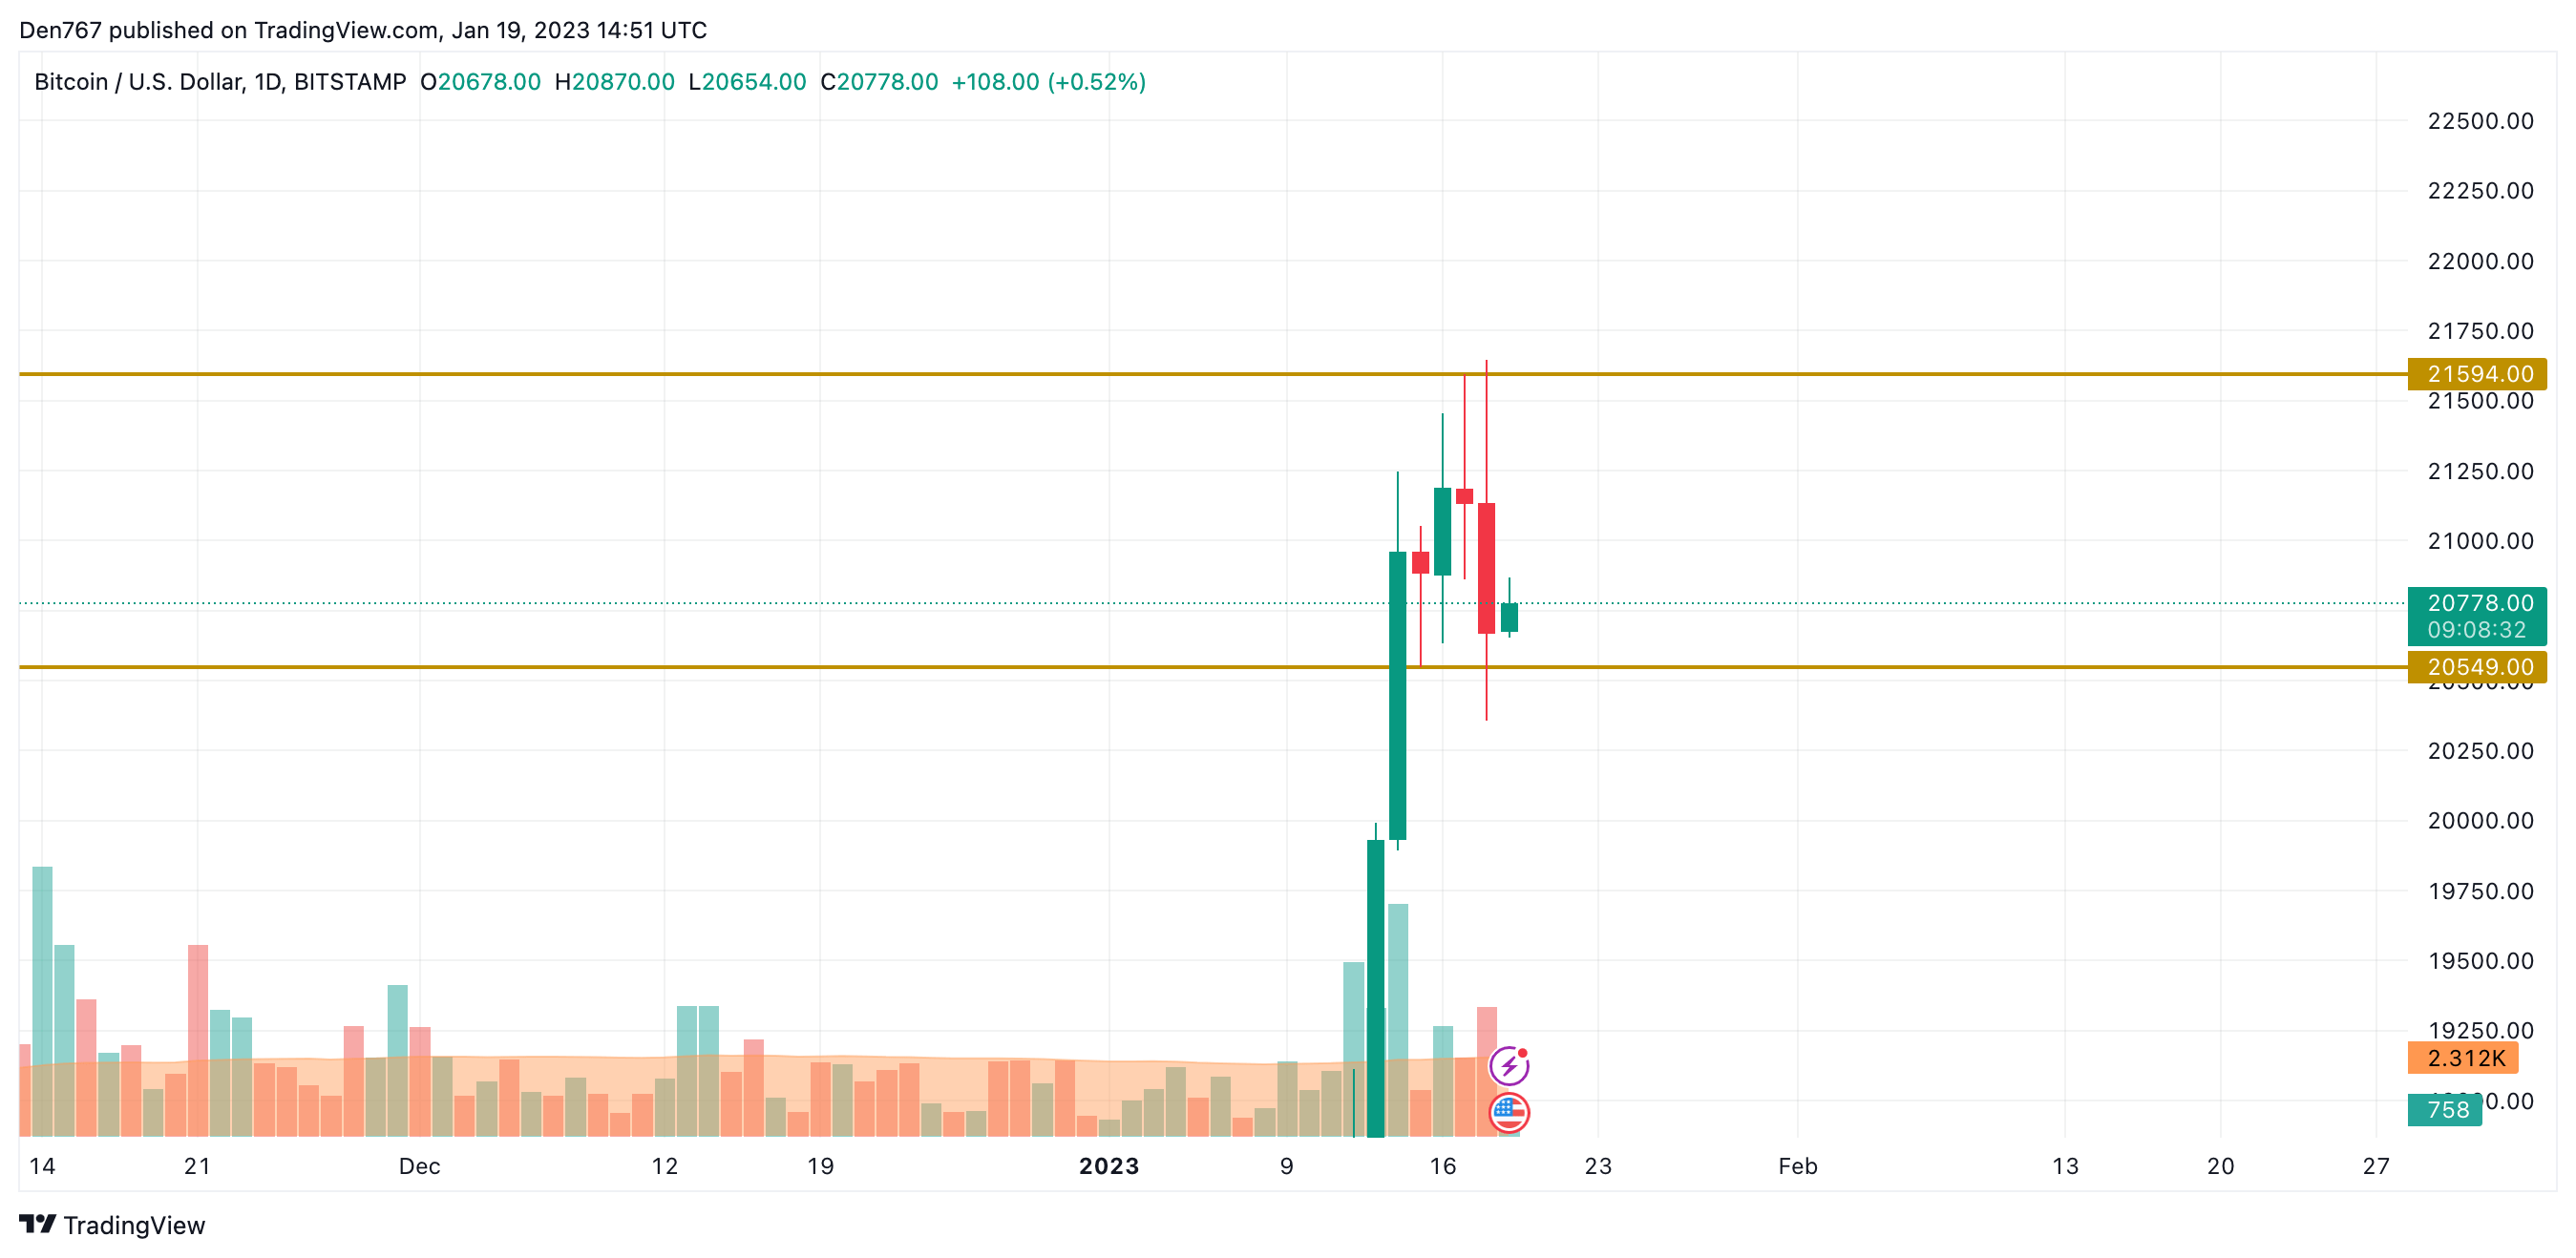
On the daily time frame, the situation is less positive as the price is located closer to the support than to the resistance, which means that bears are more powerful than bulls at the moment.
Thus, the rate is below the psychological mark of $21,000, confirming sellers’ power. In this case, the more likely scenario is the breakout of the support at $20,549, followed by a decrease to the $20,000 zone.
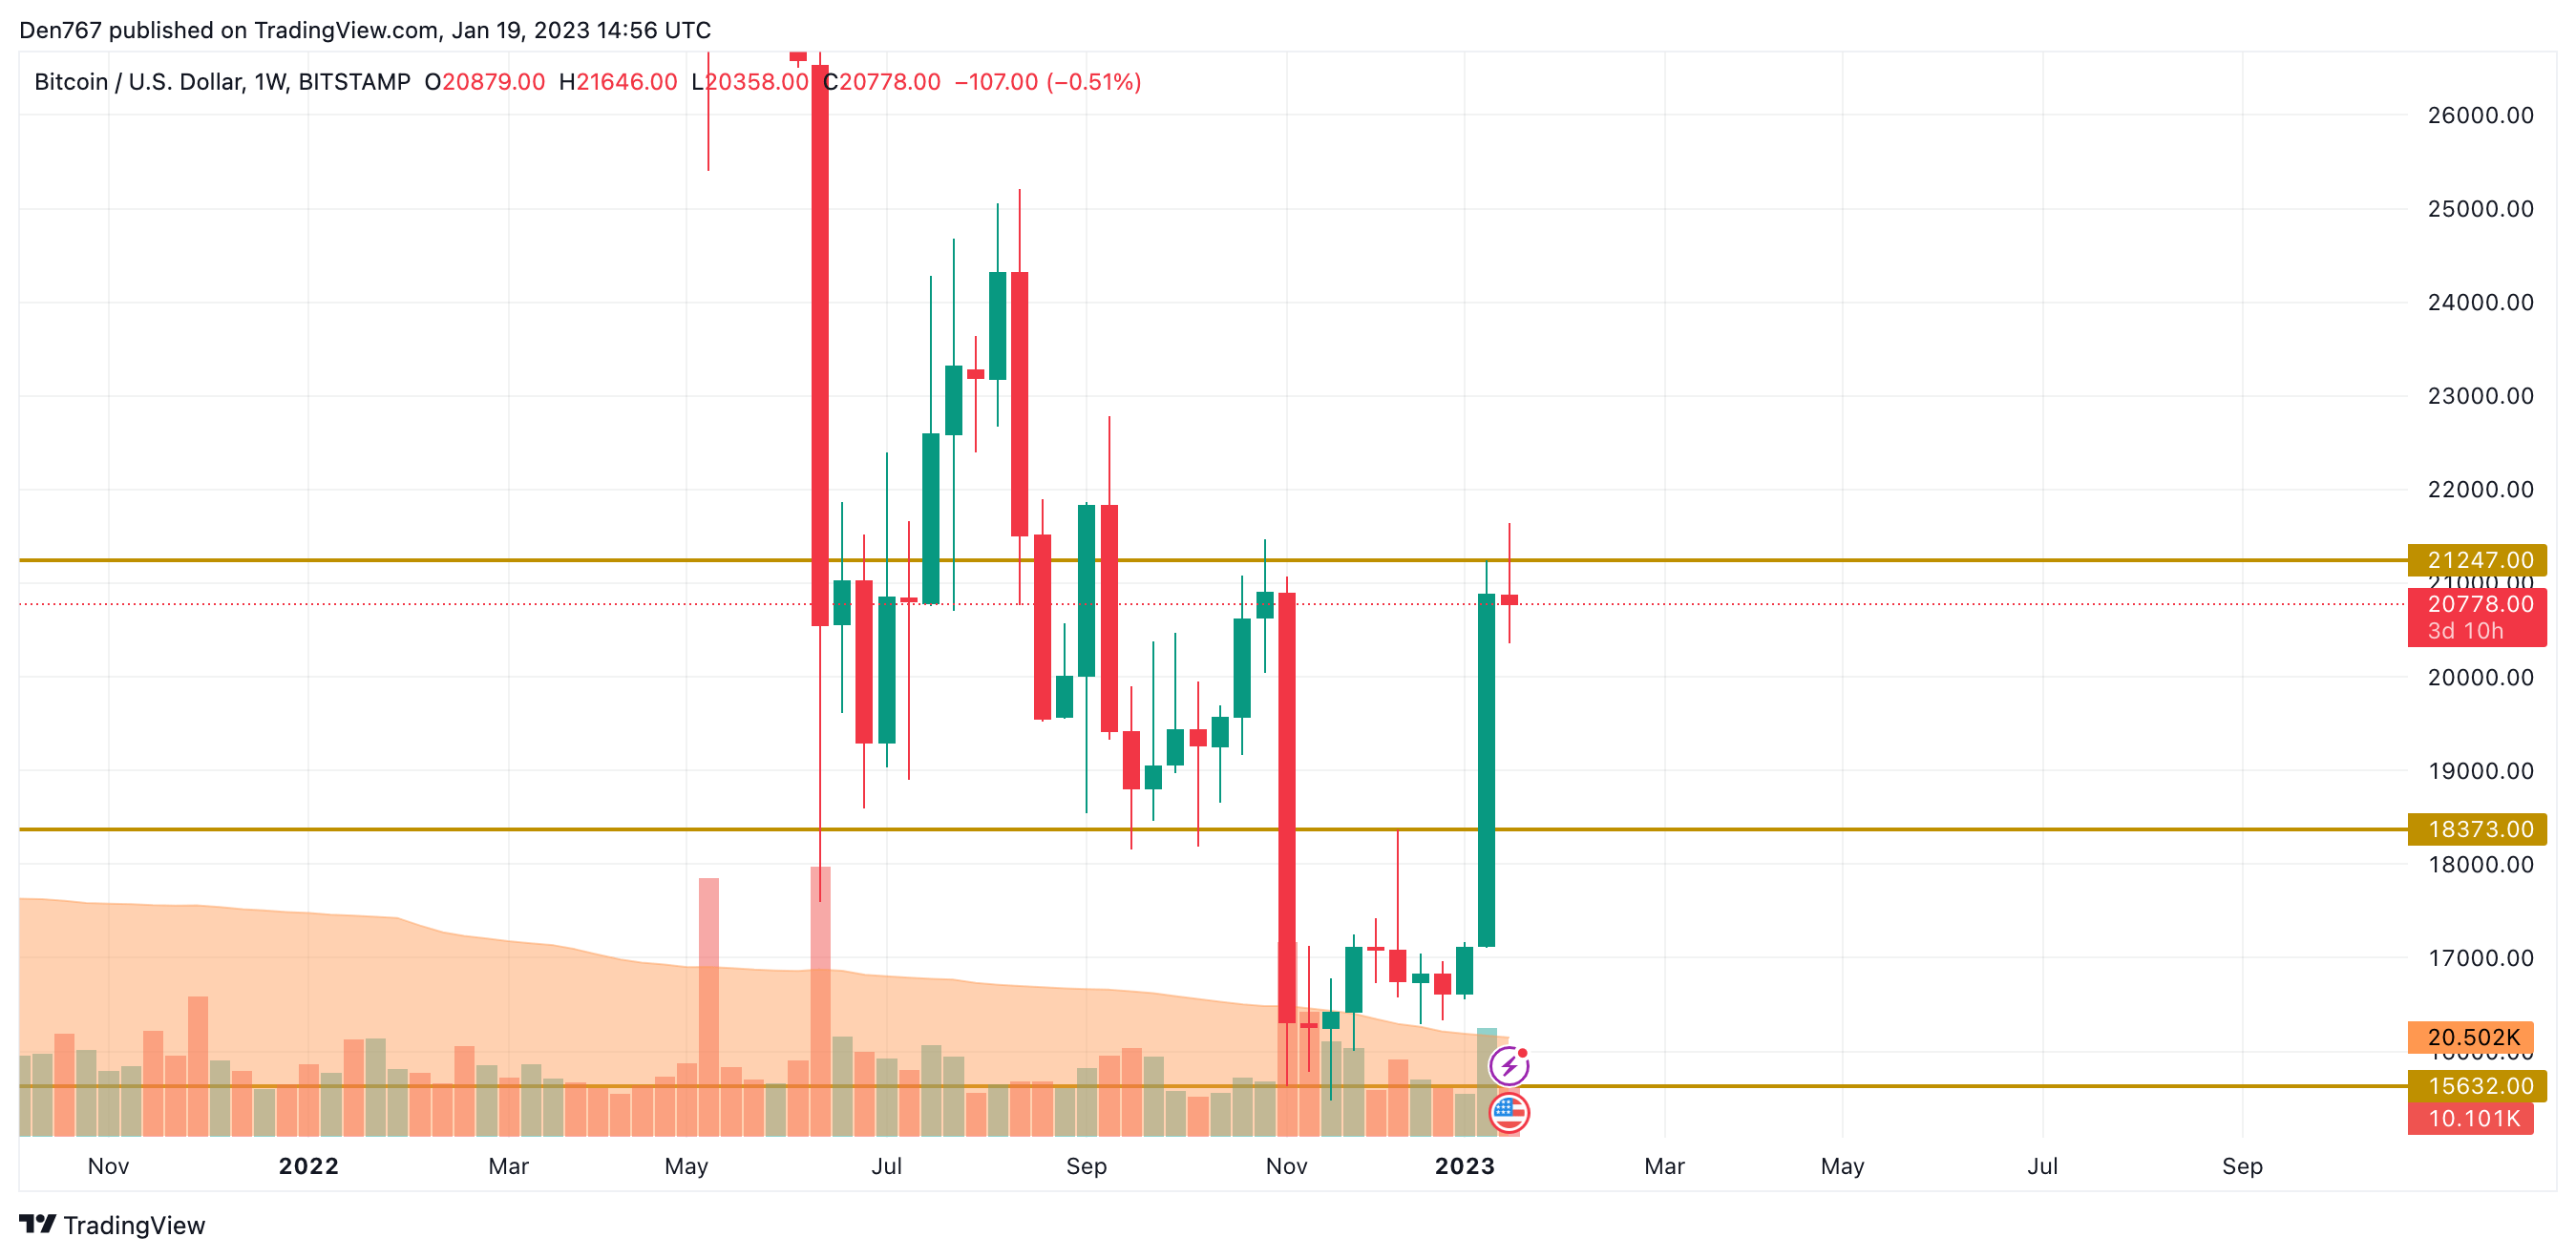
On the weekly chart, the price of Bitcoin (BTC) has made a false breakout of the recent local peak at $21,247. If buyers cannot restore the initiative by the end of the week and the rate remains below $21,000, the correction may continue to the 19,500-$20,000 zone.
Bitcoin is trading at $20,804 at press time.


 Bitcoin
  Ethereum
  Tether
  USDC
USDC  Dogecoin
  Cardano
  Bitcoin Cash
  Polygon
  Litecoin
  LEO Token
  Hedera
  Stellar
  Cosmos Hub
  OKB
OKB  Maker
Maker  Algorand
  NEO
NEO  Gate
Gate  KuCoin
  Synthetix Network
  IOTA
IOTA  Tether Gold
  TrueUSD
  Enjin Coin
  Holo
Holo  Ravencoin
  0x Protocol
  Siacoin
  Basic Attention
  Zcash
Zcash  Decred
  Ontology
  Lisk
Lisk  Waves
Waves  DigiByte
  Numeraire
  Status
  Nano
Nano  Pax Dollar
  Steem
Steem  OMG Network
  BUSD
BUSD  Ren
Ren  Bytom
Bytom  Bitcoin Diamond
  HUSD
HUSD  Energi
  Augur
Augur