


Bitcoin (BTC) to USDT chart over the 1 day time…
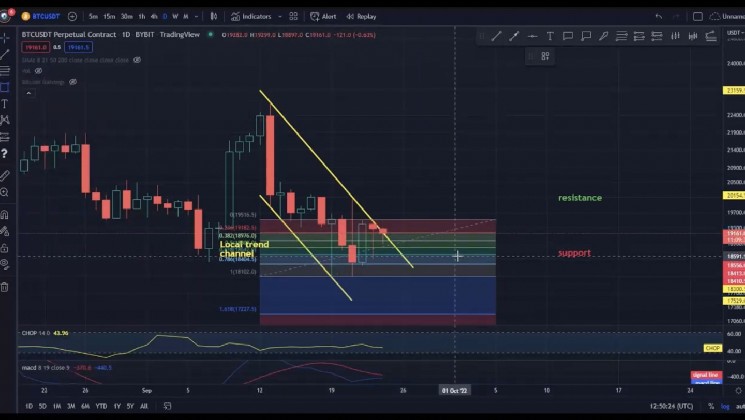
Hello everyone, let’s take a look at the Bitcoin (BTC) to USDT chart over the 1 day time frame. As you can see, the price is close to exiting the current downtrend channel.
Let’s start by determining the support that the price has in the event of a further correction, and as you can see, we have a support zone from $ 18,979 to $ 18,123 in front of us.
Now let’s move from the resistance line, as you can see, the first resistance is $ 19,222, if you can break it, the next resistance will be $ 19,899, the third resistance at $ 20,462 and the fourth resistance at $ 21,003.

Looking at the CHOP indicator, we can see that on the 1-day interval most of the energy has been used and the MACD indicator shows that the blue line is approaching the red crossing from below, which could confirm the upward trend shift.
Disclaimer: Technical Analysis is provided by a third party, and for informational purposes only. It does not reflect the views of Crypto Daily, nor is it intended to be used as legal, tax, investment, or financial advice.


 Bitcoin
  Ethereum
  Tether
  USDC
USDC  Dogecoin
  Cardano
  Bitcoin Cash
  Litecoin
  Polygon
  LEO Token
  Hedera
  Stellar
  Cosmos Hub
  OKB
OKB  Maker
Maker  Algorand
  NEO
NEO  Gate
Gate  KuCoin
  Synthetix Network
  IOTA
IOTA  Tether Gold
  TrueUSD
  Enjin Coin
  Ravencoin
  Holo
Holo  0x Protocol
  Siacoin
  Basic Attention
  Zcash
Zcash  Ontology
  Decred
  Lisk
Lisk  Waves
Waves  DigiByte
  Status
  Numeraire
  Nano
Nano  Pax Dollar
  Steem
Steem  OMG Network
  BUSD
BUSD  Ren
Ren  Bytom
Bytom  Bitcoin Diamond
  HUSD
HUSD  Energi
  Augur
Augur