


Bitcoin Dips to $18K on CPI Data, Here Are The Targets if Selling Continues (BTC Price Analysis)

Today, BTC went through some massive volatility. Accordingly, the trading volume on Binance increased exponentially. The price is struggling to hold above the $18K level, and the potential for further correction is causing fear across the market.
Technical Analysis
By Grizzly
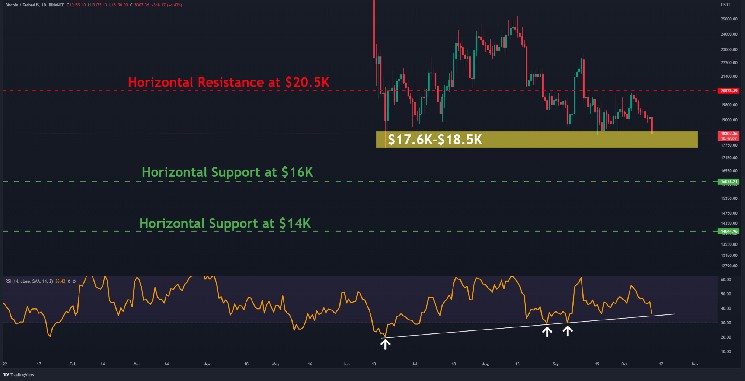
The Daily Chart:
On the daily chart, Bitcoin is trading slightly above $18K, one of the lowest levels since the market crash in June. Throughout this period, this crucial level (in yellow) has been significant support, preventing Bitcoin from plunging further.
The 14-day Relative Strength Index (RSI) is close to its diagonal support line (in white). If the downward price action continues and the pair closes below $17.6K, the way to the next support at $16K appears to be clear. This corresponds with the RSI approaching the oversold zone below 30. In the worst-case scenario, the RSI may remain below 30 for an extended period of time, perhaps resulting in Bitcoin reaching $14K on the price chart.
Alternatively, if buyers push the price over $20.5K, the bullish sentiment will be back in the market in the short term.
Key Support Levels: $17.6K & $16K
Key Resistance Levels: $20.5K & $22.7K
Daily Moving Averages:
MA20: $19349
MA50: $19757
MA100: $21084
MA200: $26752
The 4-Hour Chart:
The pair is approaching the support of the descending line (in green) on the 4-hour chart, which is about $18K. Touching this support in prior downward waves has coincided with price movement toward the diagonal resistance. If history repeats again, the potential of reclaiming the $19K would be high. Otherwise, the daily support of around $17.6K is what most of the speculators have their eyes on.
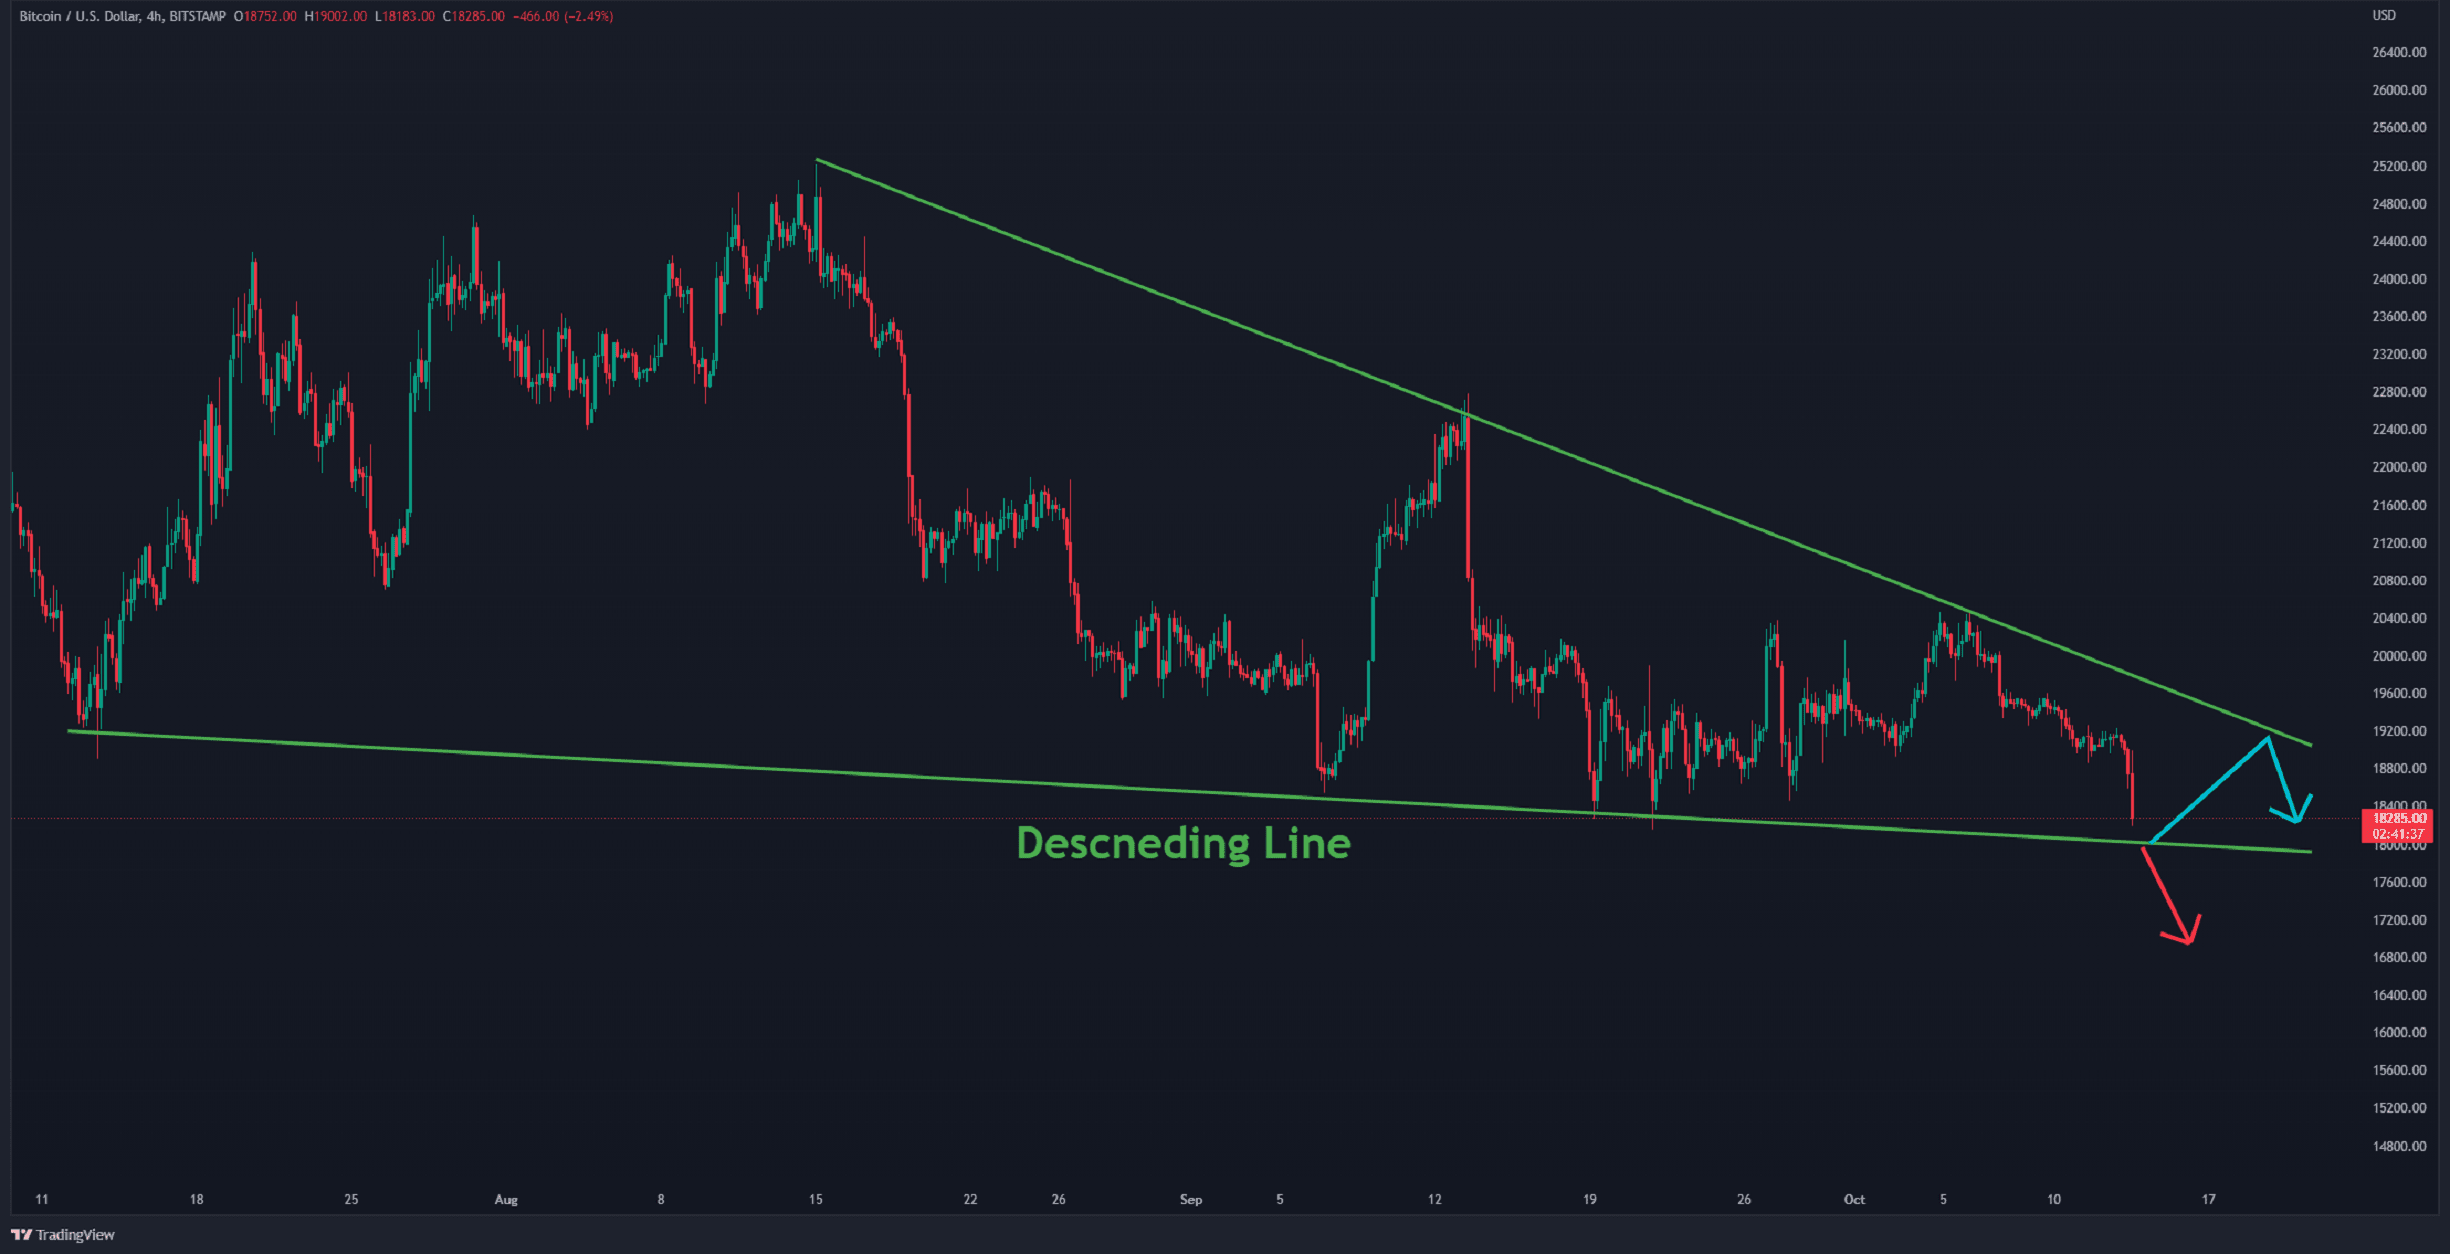
It should be highlighted that if the price closes over $19.6K in this timeframe, the hopes for bulls to enter the market will be revived.


 Bitcoin
  Ethereum
  Tether
  USDC
USDC  Dogecoin
  Cardano
  Bitcoin Cash
  Polygon
  Litecoin
  LEO Token
  Hedera
  Cosmos Hub
  Stellar
  OKB
OKB  Maker
Maker  Algorand
  NEO
NEO  Gate
Gate  KuCoin
  Synthetix Network
  IOTA
IOTA  Tether Gold
  TrueUSD
  Enjin Coin
  Holo
Holo  Ravencoin
  0x Protocol
  Siacoin
  Basic Attention
  Zcash
Zcash  Decred
  Ontology
  Lisk
Lisk  Waves
Waves  DigiByte
  Numeraire
  Nano
Nano  Status
  Pax Dollar
  Steem
Steem  OMG Network
  BUSD
BUSD  Ren
Ren  Bitcoin Diamond
  Bytom
Bytom  HUSD
HUSD  Energi
  Augur
Augur