


Bitcoin Flashing Monthly Setup Reminiscent of 2020 Bull Market, According to Crypto Analyst – Here’s His Target

A closely followed analyst believes that Bitcoin’s (BTC) current market structure appears to be mirroring a setup that emerged prior to the crypto king’s bull market in 2020.
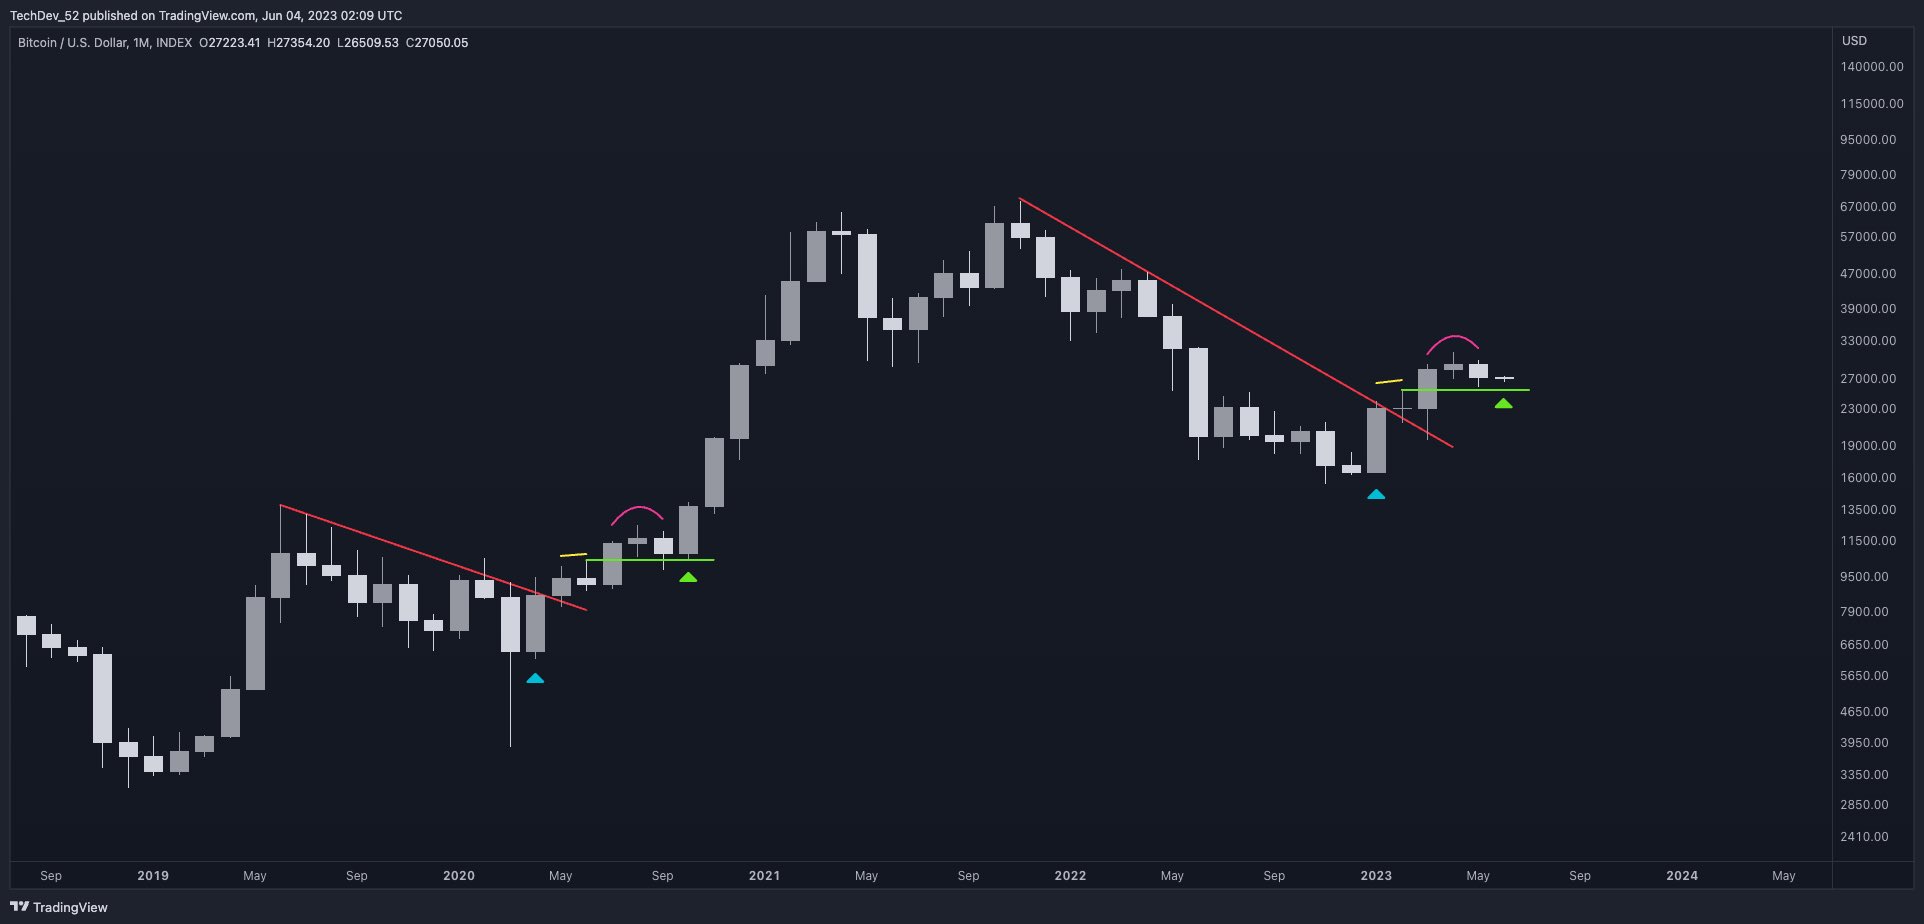
Pseudonymous analyst TechDev tells his 413,100 Twitter followers that Bitcoin’s monthly chart looks similar to BTC’s price action from about three years ago before the top crypto erupted from around $10,000 to above $60,000.
The trader shares a chart showing the similarity between the two setups, which includes a break of the bear market resistance and a retest of horizontal support.
“We’ve seen this monthly Bitcoin setup before.
At the start of the last impulse.”
Source: TechDev/Twitter
Looking at TechDev’s chart, it appears that the monthly support for BTC is around $25,000. At time of writing, BTC is trading for $25,723.
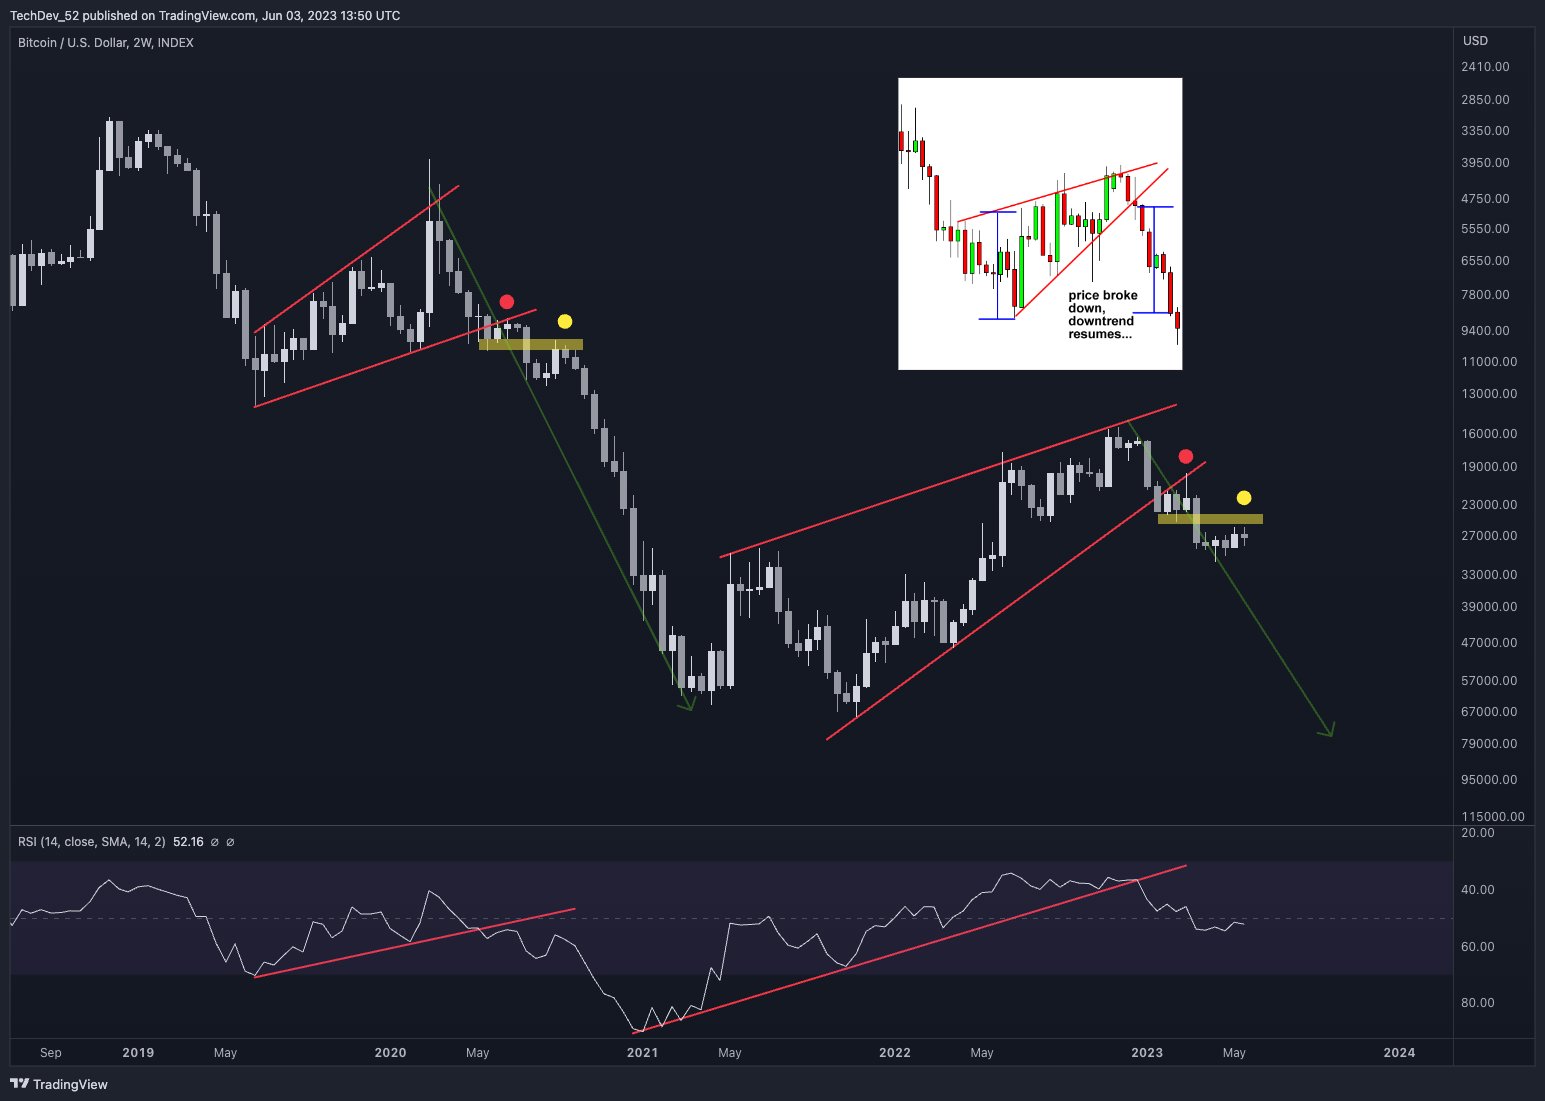
The analyst also shares an inverse chart of Bitcoin to show that BTC remains in a clear uptrend on the high timeframe.
“Longing this still seems risky. Bitcoin.”
Source: TechDev/Twitter
Looking at TechDev’s chart, it appears that Bitcoin’s price and relative strength index (RSI), a momentum indicator, have broken below their respective diagonal supports. Since the analyst is using an inverse chart, the breach of the support levels suggests that price and momentum are on the side of BTC bulls.
The chart also shows that TechDev expects Bitcoin to rally to a fresh all-time high close to $80,000.
Generated Image: Midjourney


 Bitcoin
  Ethereum
  Tether
  USDC
USDC  Dogecoin
  Cardano
  Bitcoin Cash
  Polygon
  Litecoin
  LEO Token
  Hedera
  Stellar
  Cosmos Hub
  OKB
OKB  Maker
Maker  Algorand
  NEO
NEO  Gate
Gate  KuCoin
  Synthetix Network
  IOTA
IOTA  Tether Gold
  TrueUSD
  Enjin Coin
  Holo
Holo  0x Protocol
  Ravencoin
  Siacoin
  Basic Attention
  Ontology
  Zcash
Zcash  Decred
  Waves
Waves  Lisk
Lisk  DigiByte
  Nano
Nano  Status
  Pax Dollar
  Numeraire
  Steem
Steem  OMG Network
  BUSD
BUSD  Ren
Ren  Bytom
Bytom  Bitcoin Diamond
  HUSD
HUSD  Energi
  Augur
Augur