


Bitcoin Indicators Points To Imminent Resistance Break, Study Shows

The world’s leading cryptocurrency, Bitcoin (BTC), has faced a significant resistance level of $28,600 for the past two weeks. However, despite local headwinds, Bitcoin’s natural volatility and ability to reach new local highs indicate that the resistance cluster is on the verge of breaking.
Related Reading: Dogecoin Flips Cardano In Market Cap, Becomes 7th Largest Crypto
Bitcoin Trades Above Critical Levels
According to the trading group “Birb Nest,” the recent surge in Bitcoin’s price, climbing to new yearly highs, has resulted in BTC trading above all critical long-term resistance, anchored at the 200-week and 50-week moving averages (MA), which suggests a positive outlook, as these resistance levels are crucial in determining the long-term direction of Bitcoin.
Furthermore, the trading group suggests that the daily chart indicates an “increasingly bullish outlook for Bitcoin.” This is because the primary trend represented by the 200-day MA is inclining upwards. This indicates a positive long-term trend for Bitcoin, which implies that the leading cryptocurrency in the market is leading the industry to a confirmed bull market.
Bitcoin’s Critical Anchors
In case of a potential price drop in Bitcoin’s price in the near term, the trading group has spotted critical support floors which can serve as an anchor. The BPRO baseline, a technical indicator used to analyze Bitcoin’s price movements, is inclining even more “aggressively” than the 200-day simple moving average (SMA).
This provides a new reference point at $22,800, higher than the 200 simple moving average (SMA) support at $20,500. Both levels can serve as “dynamic” support areas as Bitcoin’s price fluctuates. Furthermore, this indicates a positive signal for Bitcoin, indicating that the bullish trend may continue in the long term.
Moreover, Bitcoin’s midday chart indicates a continued sideways movement. This means that Bitcoin’s price may remain relatively stable in the short term. However, the HTF trailer of BirbicatorPRO, a technical indicator used to analyze Bitcoin’s price by the trading group, retains its bullish character.
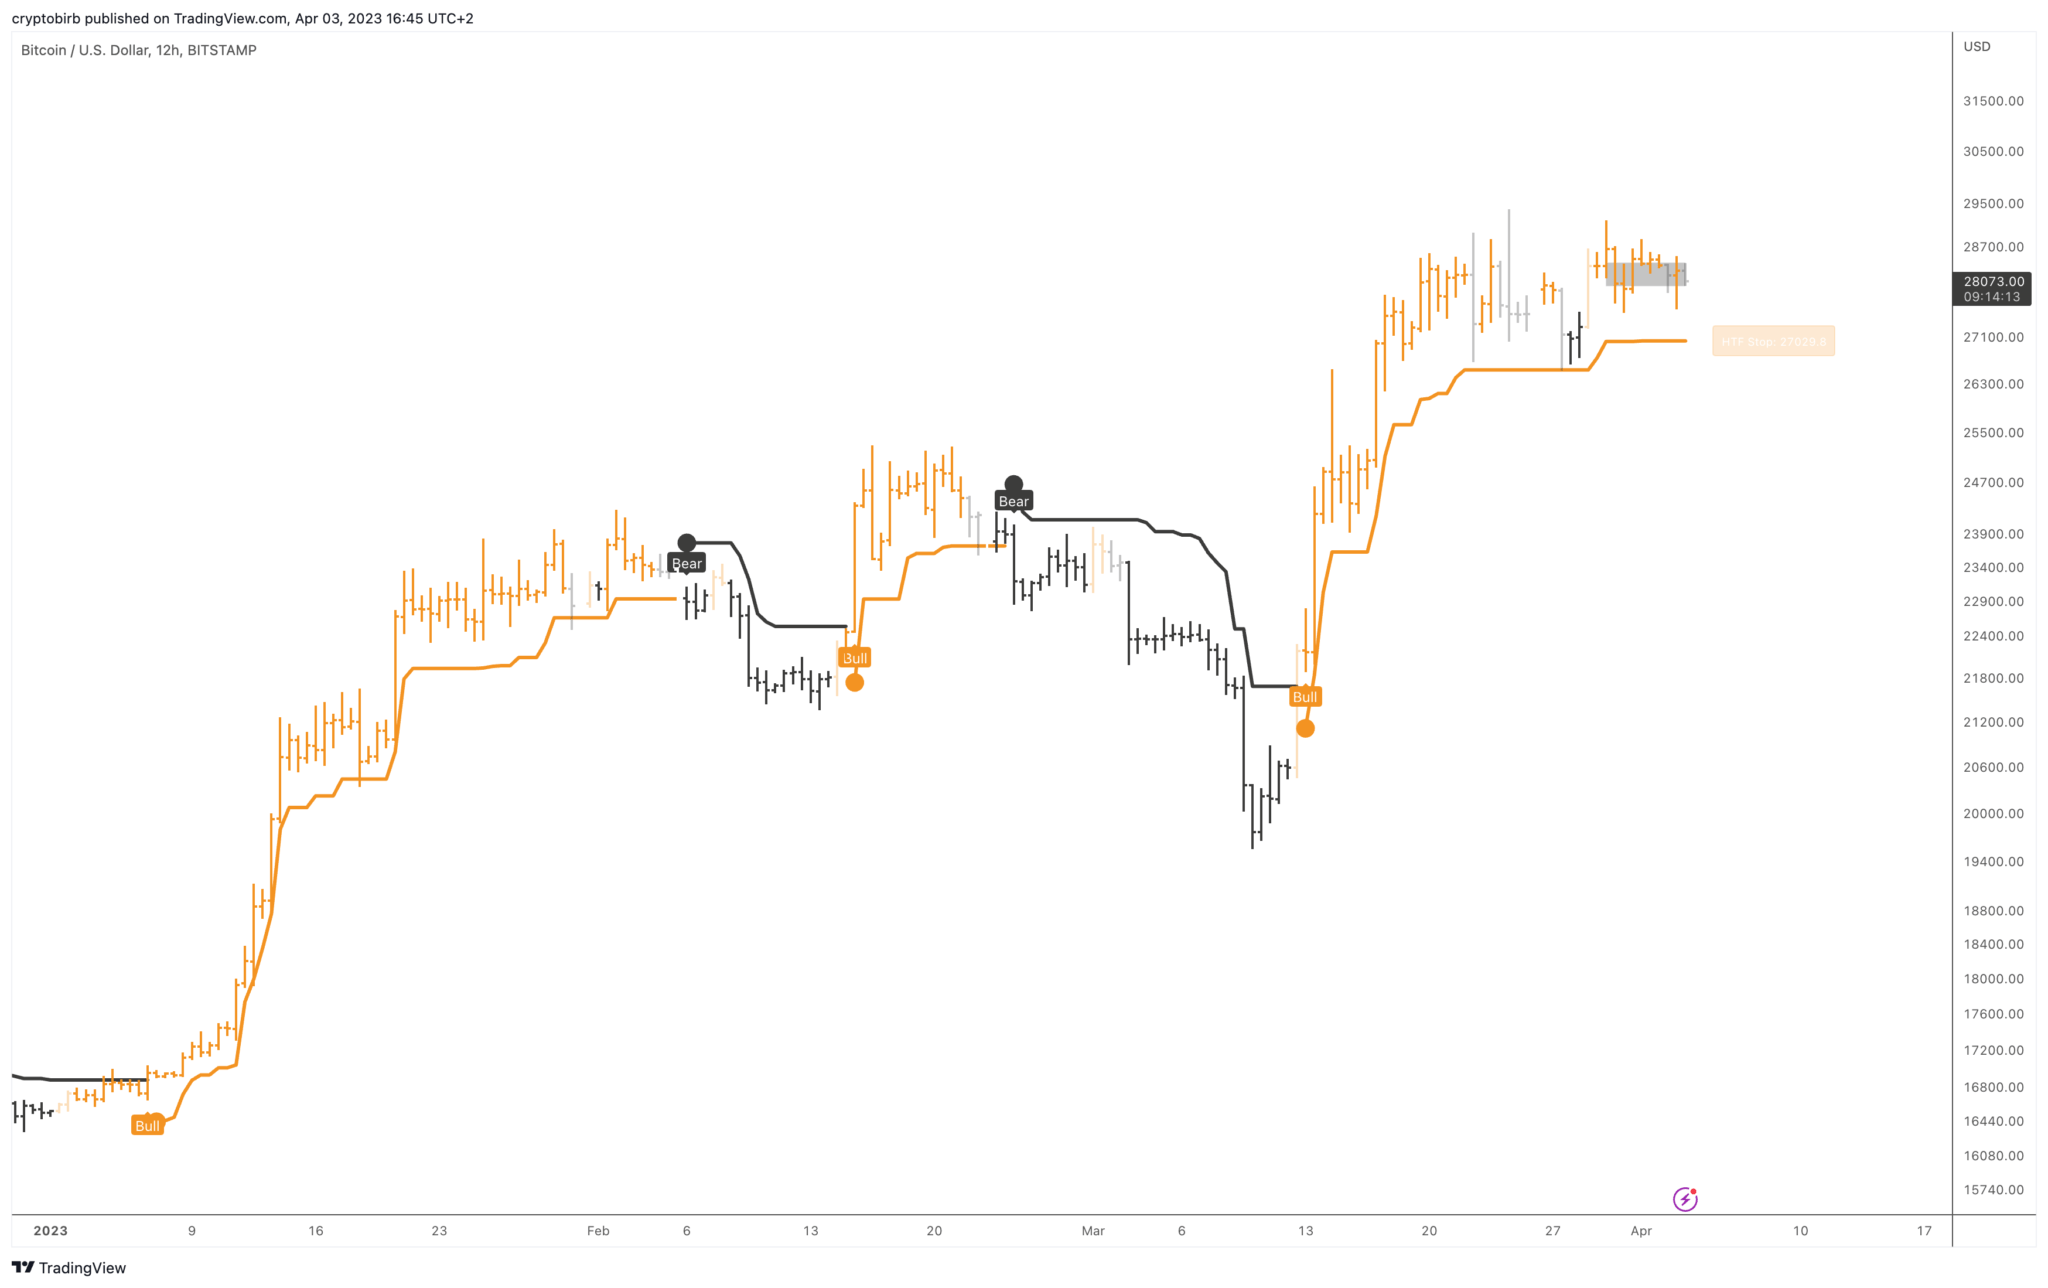
Additionally, the High Band resistance for Bitcoin is located in the $29,000 and $29,300 region, while the low band describes the support zone at $27,200. These bands are important technical indicators to predict potential price movements for BTC in the long term.
Furthermore, a potential breakout outside Bitcoin’s resistance and support bands, as seen in the chart below, may signal a more powerful market shift, potentially leading to a new short-term trend for the cryptocurrency.

At the current trading price of $28,100, Bitcoin is maintaining its consolidation within a range formed two weeks ago. Additionally, the trading group has identified several support levels of interest in case of a potential drop. These support levels, which include $25,200, $23,900, $18,600, and $16,191, can serve as reference points.
Related Reading: NFT Industry Hit Hard In March With 31% Decline In Revenue – Here’s Why

Featured image from Unsplash, chart from TradingView.com


 Bitcoin
  Ethereum
  Tether
  USDC
USDC  Dogecoin
  Cardano
  Bitcoin Cash
  Polygon
  Litecoin
  LEO Token
  Hedera
  Cosmos Hub
  Stellar
  OKB
OKB  Maker
Maker  Algorand
  NEO
NEO  Gate
Gate  KuCoin
  Synthetix Network
  IOTA
IOTA  Tether Gold
  TrueUSD
  Enjin Coin
  Holo
Holo  Ravencoin
  0x Protocol
  Siacoin
  Basic Attention
  Zcash
Zcash  Decred
  Ontology
  Lisk
Lisk  Waves
Waves  DigiByte
  Nano
Nano  Status
  Numeraire
  Pax Dollar
  Steem
Steem  OMG Network
  BUSD
BUSD  Ren
Ren  Bitcoin Diamond
  Bytom
Bytom  Energi
  HUSD
HUSD  Augur
Augur