


Bitcoin price analysis: Bears relentlessly pursue $18k lows

Bitcoin price analysis shows that the pair is clearly in strong negative headwinds as it is barely clinging onto $20,000 price level. The negative bias is aided by the thin liquidity over the weekend where traders aren’t taking any big positions. The sharp fall in equity markets on Friday is likely to continue next week and can have more negative impact on the pair.

Source: Coin360
The hawkish comments by the Fed Chair Jerome Powell will aggravate matter further in the crypto market. The consolidation near $20,000 is not concrete as the price can even fall further towards $18,000 level. The market mood is bearish as the pair oscillates near $20,000 level. Bulls are barely able to maintain volumes to cling to the $20k level.
Bitcoin price movement in the last 24 hours: Slow and steady decline below $20k
The ‘flag and pole’ pattern confirmation on the charts is a huge bearish signal. The bears are creating large sell positions for the last 24-48 hours in order to break below $20,000 mark. The gradual movement near $20,000 level shows that the pair is losing steam as it walks into the weekend with thin volumes as per Bitcoin price analysis. The pair is constantly moving close to 50-day exponential moving average but is getting rejected repeatedly.
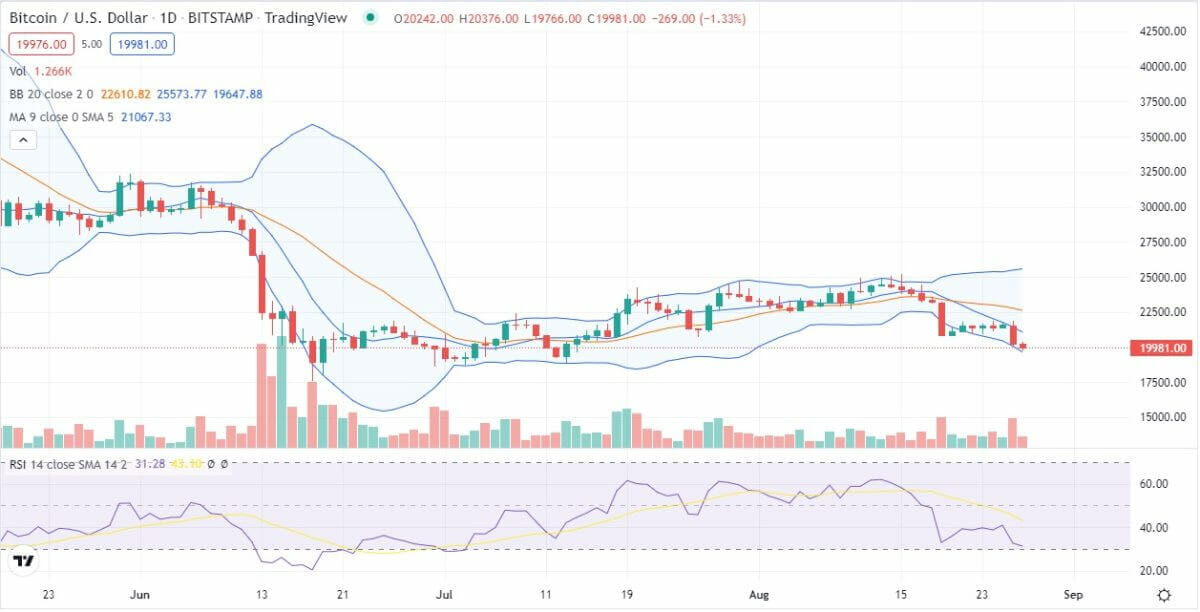
Source: TradingView
Selling has intensified over the last two days as the price was already weak near $22,000 support zone. As per Bitcoin price analysis, it quickly broke below the mark to move below the 20-day exponential moving average near $22,000. The extended move has since intensified to bring the price down below $20,500 level.
BTC/USD 4-hour chart: Range bound or more pain?
The support at $20,000 has been fairly strong in the past as the pair has seen bounce near this level earlier. However, the rising flag and pole pattern is the concern which can move the price near $18,500 over the next few days. The support at $19,000 will be the first level to watch in case bears increase their selling in line with the equity markets.

Source: TradingView
Bitcoin price analysis shows that the bears are following ‘sell on rise’ pattern to plan out their trades. So, every bounce is being sold into on the BTC charts. The RSI is near 30 and shows no signs of any reversal any time soon. The MACD line is also nowhere close to a crossover.
Bitcoin price analysis conclusion: September will be bearish?
As another month dawns, the Bitcoin price analysis turns more bearish. The $21,000 level has been broken confidently by the bears on the daily charts. It seems like the September effect has taken over BTC one more time. Bitcoin has been known historically to fall in the month of September and this year seems no different.
The fall in the equity markets along with the macro concerns will only take BTC downwards. The price aims to target $18,000 and post fresh new lows.
Disclaimer. The information provided is not trading advice. Cryptopolitan.com holds no liability for any investments made based on the information provided on this page. We strongly recommend independent research and/or consultation with a qualified professional before making any investment decisions.


 Bitcoin
  Ethereum
  Tether
  USDC
USDC  Dogecoin
  Cardano
  Bitcoin Cash
  Polygon
  Litecoin
  LEO Token
  Hedera
  Cosmos Hub
  Stellar
  OKB
OKB  Maker
Maker  Algorand
  NEO
NEO  Gate
Gate  KuCoin
  Synthetix Network
  IOTA
IOTA  Tether Gold
  TrueUSD
  Enjin Coin
  Holo
Holo  Ravencoin
  0x Protocol
  Siacoin
  Basic Attention
  Zcash
Zcash  Ontology
  Decred
  Lisk
Lisk  Waves
Waves  DigiByte
  Pax Dollar
  Status
  Numeraire
  Nano
Nano  Steem
Steem  OMG Network
  BUSD
BUSD  Ren
Ren  Bitcoin Diamond
  Bytom
Bytom  HUSD
HUSD  Energi
  Augur
Augur