


Bitcoin price analysis: Bounce back fades as BTC retests $20,700

Bitcoin price analysis is getting choppy once again. The sustainability of the bounce back rally of Bitcoin towards $22,800 is in question. The price has been falling towards $20,680 and the bears have been successful in bringing down the BTC/USD price. the support at $20,000 may be tested as the short-term rally sputters.
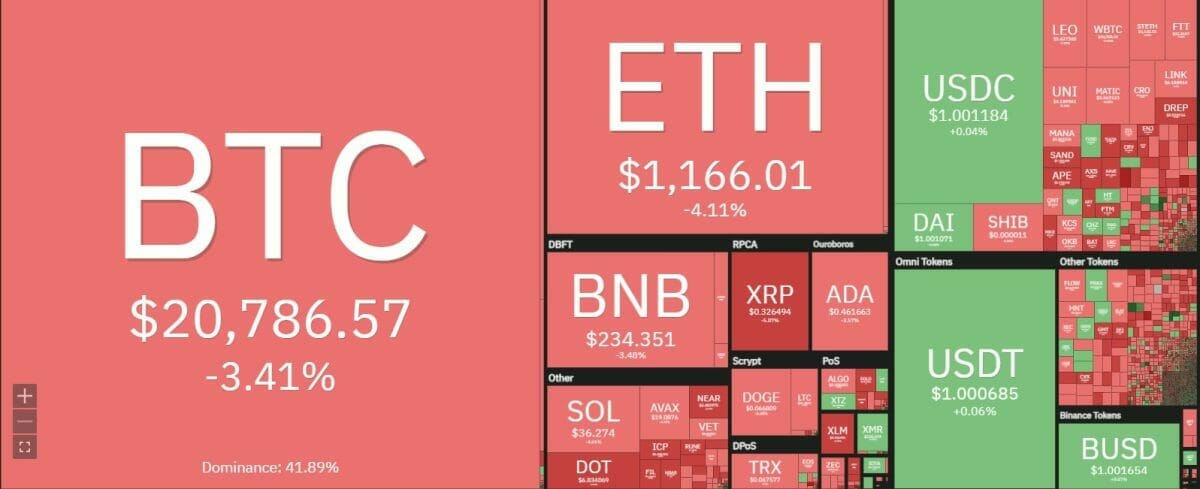
Source: Coin360
As the price fluctuates and the bulls are unable to drive away the selling fears, the BTC/USD pair will only move towards lower levels. Over the weekend, the volumes have been thin which might have led to the downfall in the prices. The sellers have not yet moved away from the picture. The current Bitcoin price analysis shows a downward trajectory where the prices can once again touch lows near $18,800.
Bitcoin price movement in the last 24 hours: Slowly fading away from recent highs
The bearish reversal is evident from the price action moving away from the 20-day EMA. The RSI is rising slowly and the underlying bullishness is fading away on the hourly charts. The daily Bitcoin price analysis shows just $31.9 billion in intraday trading volume. There is a definite range to the BTC/USD pair as the market participants await a clear picture to emerge.
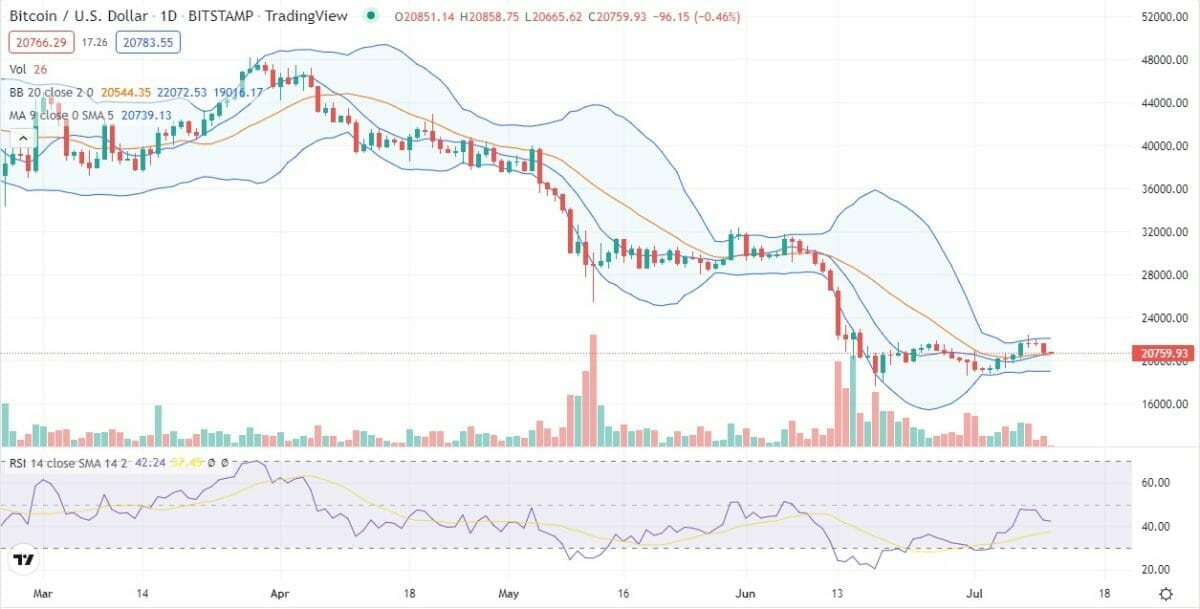
Source: TradingView
The failed attempt to reach higher bullish levels to cross $24,000 confidently will only complicate matters on the technical indicators front. Only aggressive buying by the bulls will shift the picture towards buying side. The daily charts also indicate a sideways movement for the upcoming week in absence of any massive volume-driven change. On the lower side, the $18,500 support is likely to support the pair well.
BTC/USD 4-hour price chart: Sideways movement restricts higher lows
Bitcoin price analysis shows that the pair retested the higher lows on the daily long-wick candle. The supply pressure remains strong. The price is oscillating near the 20-day EMA in a bid to create resistance above the $21,800 level. The recent failed attempt to cross over this price has triggered the current sell-off as per Bitcoin price analysis. Thus, the hourly candle, if short-wick, can trigger another round of selling towards the $19,000 level as the day advances.
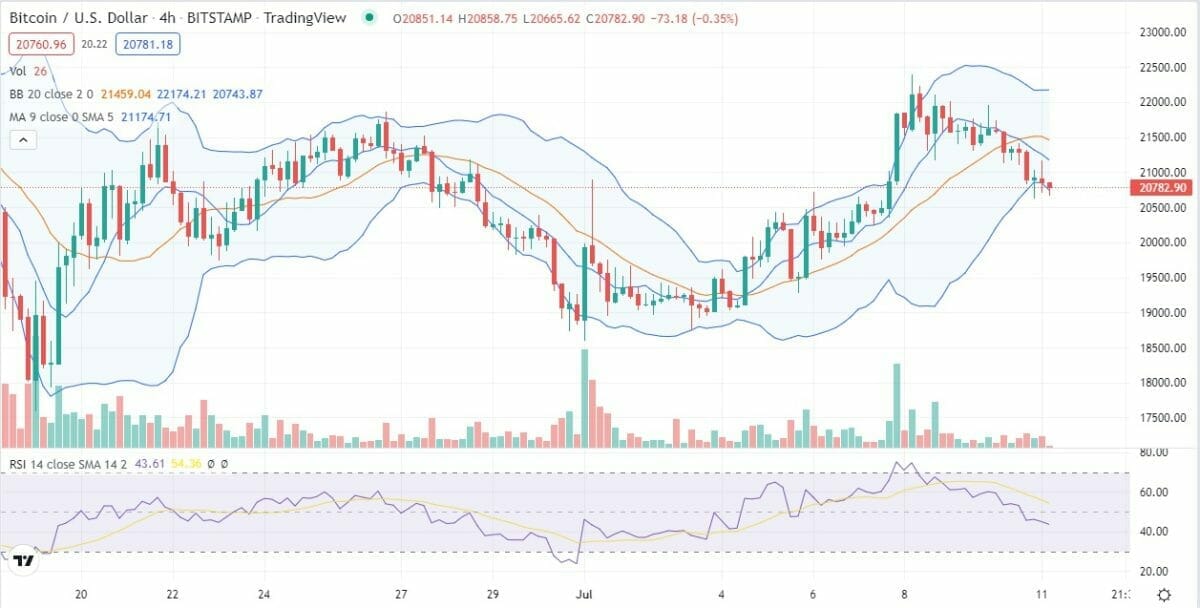
Source: TradingView
The upper Bollinger band shows a downwards slope with $22,688 as the higher level. It would prove tough for the bulls to move beyond these levels in the current context. The lower level is fast approaching $18k zone which can be a worrying sign for the bulls. The range-bound rally can quickly turn into a declining bull trap. The RSI is slowly fading back towards 40 levels and the MACD is not showing any immediate cross over signal.
Bitcoin price analysis conclusion: Prepare for another leg down
As the buyers lose the edge over the weekend, there are no hopes of a quick bullish reversal. The price will only deviate lower since the bulls do not have enough leverage in the current context. There is no clear indication about another move towards $22,400 resistance level without any significant rise in the volume.
The support at $18,500 can break if the bull trap materializes along with a macro news. The support at $17,800 will bring grave concern to the BTC bulls. Bitcoin price analysis shows that the current week’s start has been bearish as the pair rejects short-term rally.


 Bitcoin
  Ethereum
  Tether
  USDC
USDC  Dogecoin
  Cardano
  Bitcoin Cash
  Polygon
  Litecoin
  LEO Token
  Hedera
  Stellar
  Cosmos Hub
  OKB
OKB  Maker
Maker  Algorand
  NEO
NEO  Gate
Gate  KuCoin
  Synthetix Network
  IOTA
IOTA  Tether Gold
  TrueUSD
  Enjin Coin
  Ravencoin
  Holo
Holo  0x Protocol
  Siacoin
  Basic Attention
  Decred
  Zcash
Zcash  Ontology
  Lisk
Lisk  Waves
Waves  DigiByte
  Numeraire
  Status
  Nano
Nano  Pax Dollar
  Steem
Steem  OMG Network
  BUSD
BUSD  Ren
Ren  Bytom
Bytom  Bitcoin Diamond
  HUSD
HUSD  Energi
  Augur
Augur