


Bitcoin Price Analysis: Is $BTC Price Heading Back to $25000?
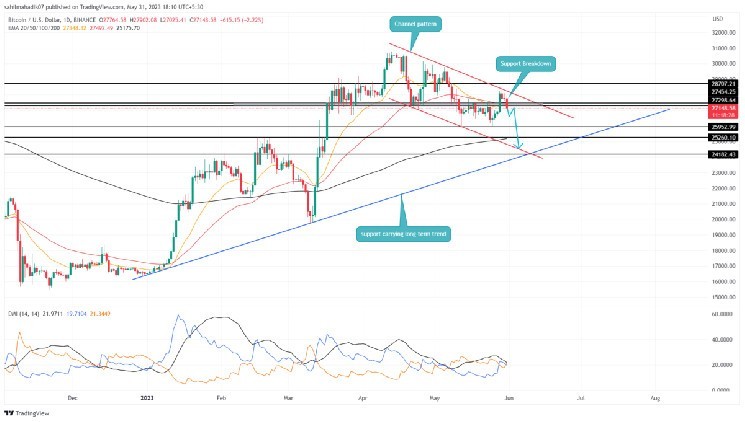
Bitcoin Price Analysis: On May 29th, the Bitcoin price turned down from the resistance trendline of the channel pattern. This bearish reversal within the channel indicates the BTC price is likely to continue on a correction path which may also plunge below the $26000 monthly low. Here’s how this pattern could further influence the BTC’s future trend.
Also Read: Bitcoin Outperforms Gold, Crude Oil; Bitcoin Bull Run Ahead?
Bitcoin Price Daily Chart
- Usually, a bearish reversal from this pattern’s resistance trendline recuperates the selling momentum and plunges the price back to a lower trendline.
- A breakdown below the $27500-$27300 support zone intensifies the supply pressure to prolong the prior downfall.
- The intraday trading volume in Bitcoin is $15.5 Billion, indicating a 19% gain.
Source-Tradingview
With an intraday loss of 2.22%, the Bitcoin price breached a significant support zone of $27500-$27300. The buyers very recently reclaimed this level, and an instant breakdown indicates the market participants continue to sell on price rallies.
If the daily candle closes below the $27300 level, interested traders may get an opportunity to short-sell and boost the supply pressure in the market. Therefore, the resulting downfall may plunge the BTC price to $24500 creating a new lower low in its ongoing downtrend.
While things look bearish for the Bitcoin price, a decisive breakout above the channel pattern’s trendline will undermine the bearish momentum and may trigger a new recovery rally.
Will Bitcoin Price Break Below $25000?
In theory, a bearish reversal from the resistance trendline of the channel pattern is most likely to trigger a downfall to $25000. Thus, with sustained selling the ongoing bear cycle in Bitcoin may plunge the prices below $26000 and $25200 support to hit the lower trendline near $24600.
- Directional Moving Index: A DI- slope(orange) crossing above the D+ slope(blue) projects a bear trend sentiment in the market.
- Exponential Moving Average: Along with the $27300 support breakdown, the BTC buyers also lost the 20-and-50-day EMAs giving an extra edge to short-sellers.


 Bitcoin
  Ethereum
  Tether
  USDC
USDC  Dogecoin
  Cardano
  Bitcoin Cash
  Polygon
  Litecoin
  LEO Token
  Hedera
  Cosmos Hub
  Stellar
  OKB
OKB  Maker
Maker  Algorand
  NEO
NEO  Gate
Gate  KuCoin
  Synthetix Network
  IOTA
IOTA  Tether Gold
  TrueUSD
  Ravencoin
  Holo
Holo  Enjin Coin
  Siacoin
  0x Protocol
  Basic Attention
  Zcash
Zcash  Decred
  Ontology
  Lisk
Lisk  Waves
Waves  DigiByte
  Numeraire
  Status
  Nano
Nano  Pax Dollar
  Steem
Steem  OMG Network
  BUSD
BUSD  Ren
Ren  Bytom
Bytom  Bitcoin Diamond
  Augur
Augur  Energi
  HUSD
HUSD