


Bitcoin Price Analysis: Multiple Resistances Put BTC Price Under 10% Downside Risk

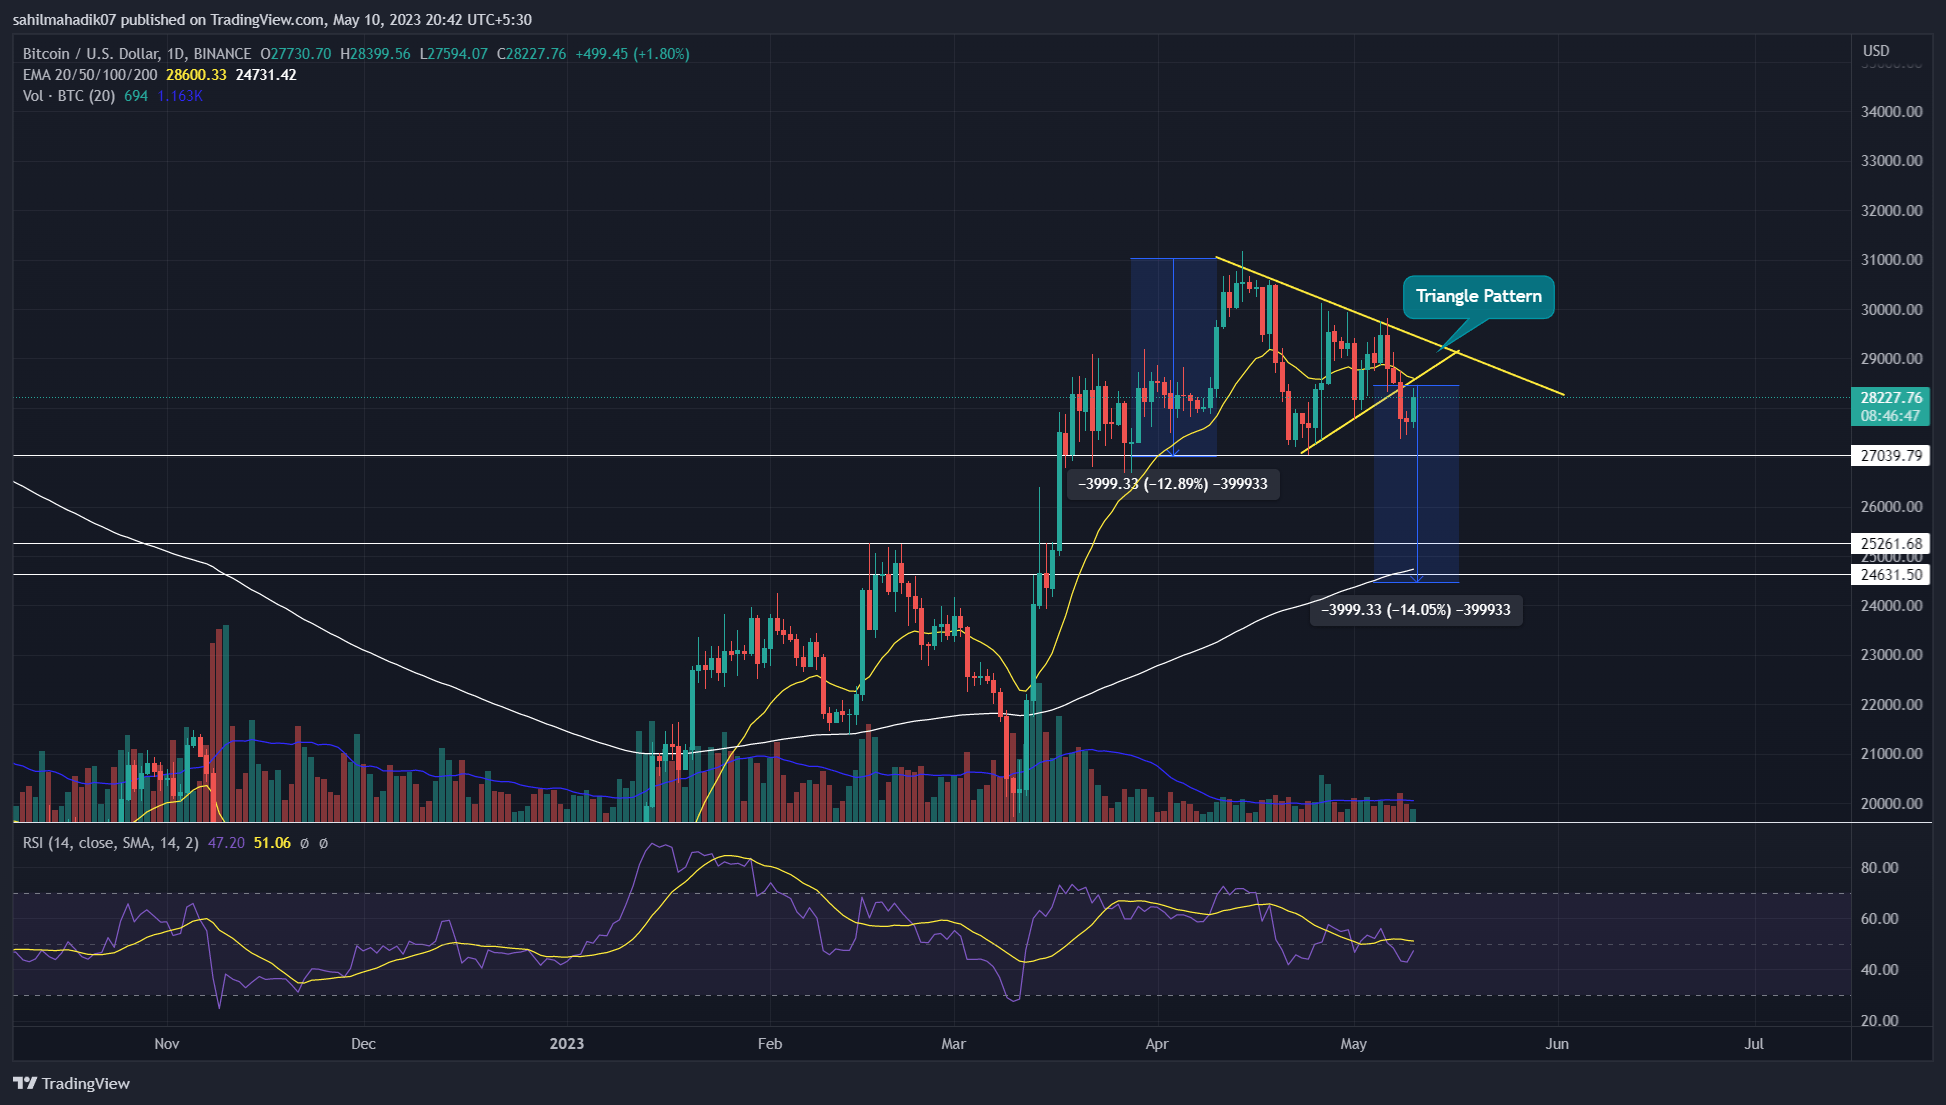
Bitcoin Price Analysis: On May 8th, the Bitcoin price gave a bearish breakdown from the support trendline of a symmetrical triangle pattern. This pattern created a consolidation phase for over three weeks and its end meeting on a bearish note intensifies the underlying selling momentum in the market. Here’s how long the BTC price is threatened to correct under the influence of this pattern.
Key Points:
- Bitcoin Fear & Greed Index plunged to 52% reflecting fear sentiment among traders
- The $25000 support stands as a crucial accumulation phase for market participants.
- The intraday trading volume in Bitcoin is $15.3 Billion, indicating a 5.43% loss.
Source-Tradingview
In theory, the potential target for short-sellers when the asset price breached the support trendline is the same price distance present between the largest swing high within the pattern shot from the breakdown points.
Thus, under ideal conditions, the Bitcoin price is poised for a 13.5% downfall to hit the $24600 mark. However, the potential downfall may face significant support at a 4.2% down level at $27000 or a 10% down level at $25200.
Also Read: Top Web 3 Phones And Their Specifications
On a contrary note, the Bitcoin price is 2% on intraday and currently trades at $28242. This sudden rise is likely associated with the lower-than-expected annual U.S. CPI data for April 2023.
Thus, the price currently retests the breached support trendline to check price sustainability after the breakdown. If the sellers manage to hold below the flipped trendline, Bitcoin is likely to hit the aforementioned targets.
However, on the upside, the buyers need to breach the triangle’s pattern both support and resistance trendlines retake trend control
Technical Indicator
Exponential Moving Average: The 20-day EMA acts as dynamic resistance undermining the efforts of buyers to reach a higher level.
Relative Strength Index: The RSI slope wavering below the midline reflects the sellers are having a dominant hand
Bitcoin Price Intraday Levels
- Spot rate: $28178
- Trend: Bullish
- Volatility: Medium
- Resistance levels- $31200 and $34600
- Support levels- $27000 and $25000


 Bitcoin
  Ethereum
  Tether
  USDC
USDC  Dogecoin
  Cardano
  Bitcoin Cash
  Polygon
  Litecoin
  LEO Token
  Hedera
  Cosmos Hub
  Stellar
  OKB
OKB  Maker
Maker  Algorand
  NEO
NEO  Gate
Gate  KuCoin
  Synthetix Network
  IOTA
IOTA  Tether Gold
  TrueUSD
  Enjin Coin
  Holo
Holo  0x Protocol
  Ravencoin
  Siacoin
  Basic Attention
  Zcash
Zcash  Decred
  Ontology
  Lisk
Lisk  Waves
Waves  DigiByte
  Status
  Numeraire
  Nano
Nano  Pax Dollar
  Steem
Steem  OMG Network
  BUSD
BUSD  Ren
Ren  Bitcoin Diamond
  Bytom
Bytom  HUSD
HUSD  Energi
  Augur
Augur