


Bitcoin Price Analysis: Will $BTC Surpass $27500 Before Weekend?
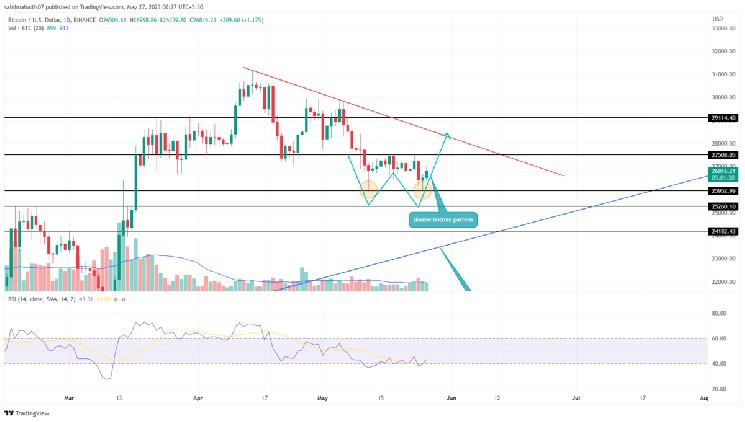
In the midst of two-weeks consolidation, the Bitcoin price bounced back twice the local support of $26000. Using this psychological level as a base, the daily chart shows a double-bottom pattern formation. This chart pattern is known to accumulate buying pressure at lower support and triggers a bullish reversal. Thus this pattern could assist the BTC price in escaping the market’s current volatile phase.
Also Read: Bitcoin Core’s Latest Update Promises Major Performance Boost, BTC Price To Rally?
Bitcoin Price Daily Chart
- A potential breakout from the $27500 neckline resistance of the double bottom pattern may encourage a bullish recovery in the BTC price
- The midline of the Bollinger band indicator acts as active resistance trying to restrict bullish growth.
- The intraday trading volume in Bitcoin is $5.68 Billion, indicating a 12.5% loss.
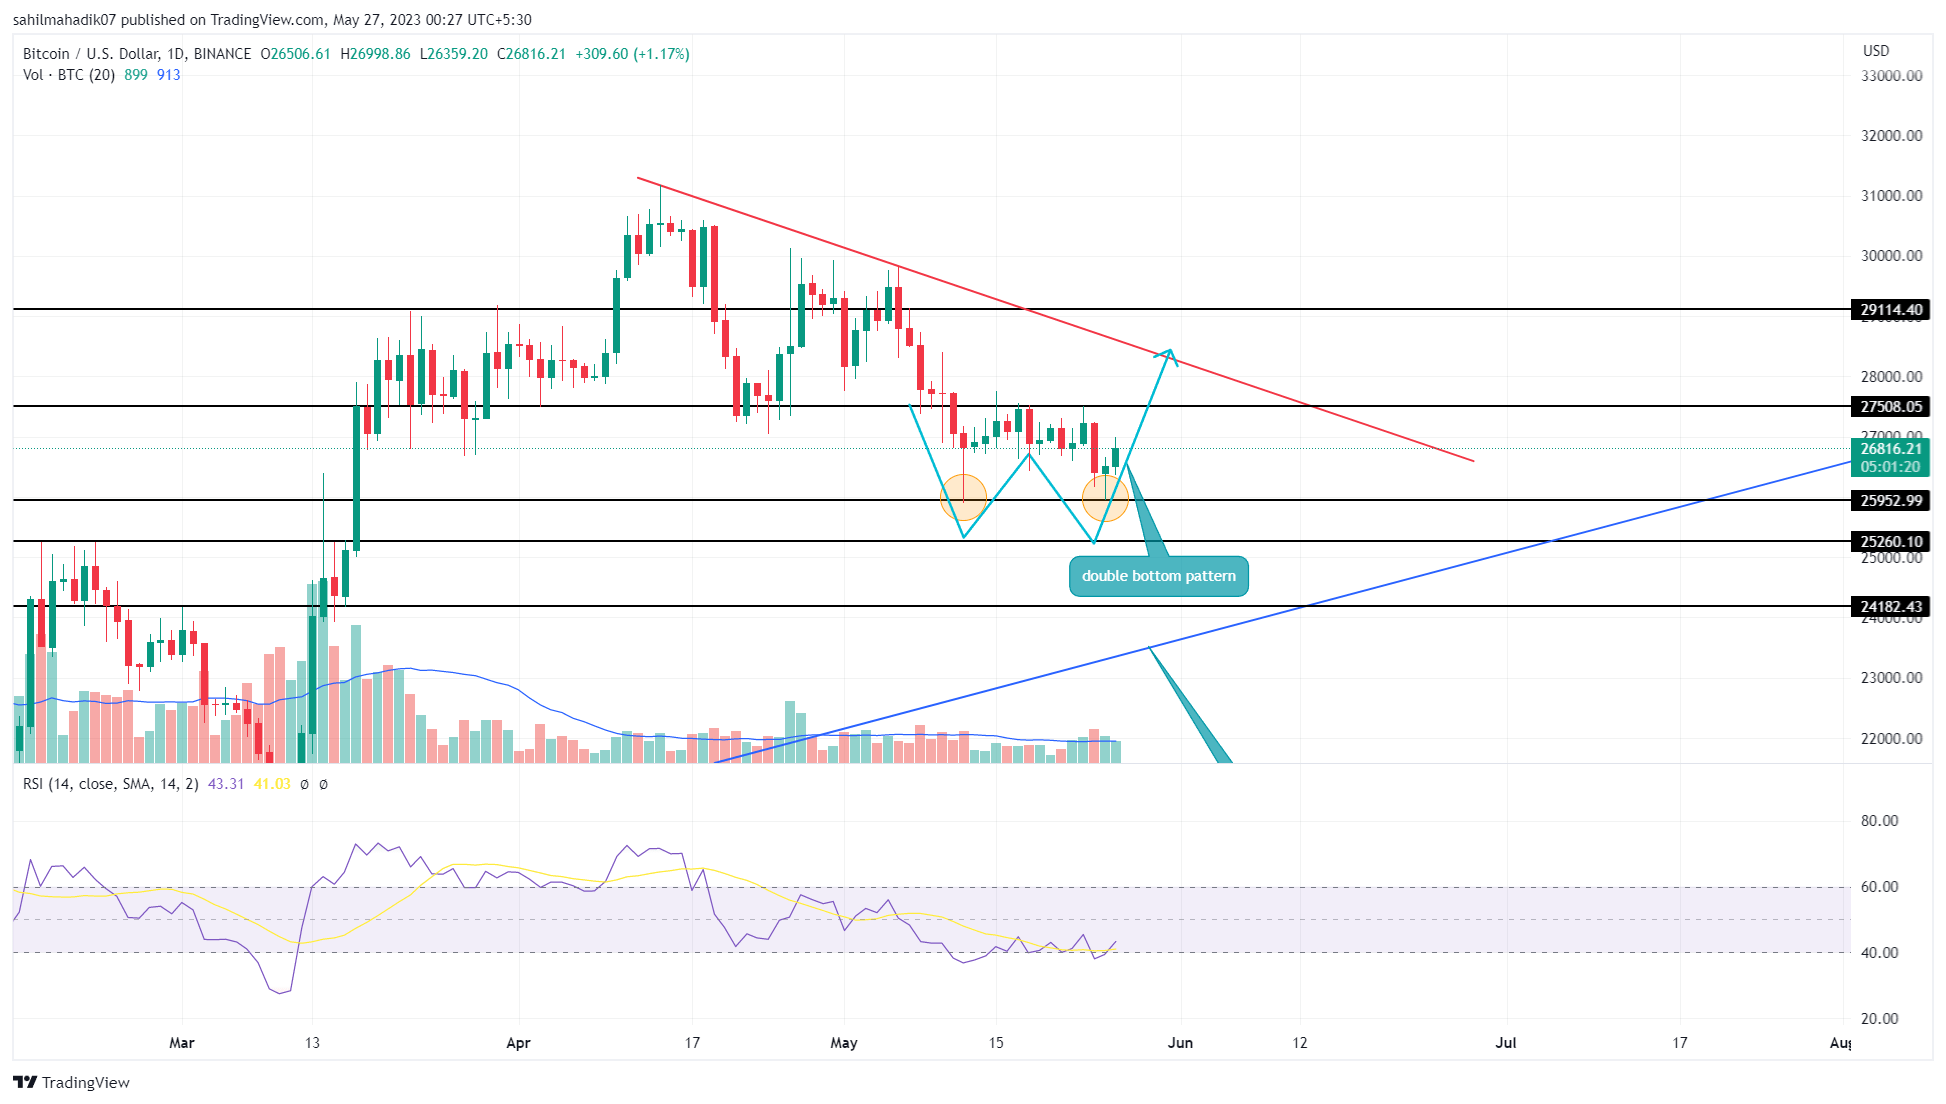
Source-Tradingview
In the daily time frame chart, the Bitcoin price shows a formation of a bullish reversal candle morning star $26000 support. This reversal will fuel the development of the aforementioned double-bottom pattern and push the prices to immediate resistance of $27500.
A breakout above the neckline resistance will be crucial to complete the chart pattern as it boasts the buying momentum in this coin. If the daily candle closes above $27500, the buyers will obtain a suitable springboard to climb higher levels.
This development will encourage buyers to attempt a strong breakout at the long-coming resistance trendline. This dynamics resistance is the key gateway for resuming the prevailing recovery in Bitcoin.
Will Bitcoin Price Surpass $27500?
At the time of writing Bitcoin price is up by small 0.8% over last 24 hrs and is currently $26, 686. Under the influence of the double bottom pattern, the Bitcoin price is likely to witness a bullish upswing in the daily chart. This reversal is bound to breach the $27500 neckline resistance and resolve the current indecisiveness sentiment in the market.
- Bollinger Band: An uptick in the lower band of the BB indicator offers additional support for a bullish reversal.
- Vortex indicator: A higher low formation in the daily RSI slope accentuates the active accumulating from buyers at $26000.


 Bitcoin
  Ethereum
  Tether
  USDC
USDC  Dogecoin
  Cardano
  Bitcoin Cash
  Polygon
  Litecoin
  LEO Token
  Hedera
  Stellar
  Cosmos Hub
  OKB
OKB  Maker
Maker  Algorand
  NEO
NEO  Gate
Gate  Synthetix Network
  KuCoin
  IOTA
IOTA  Tether Gold
  TrueUSD
  Holo
Holo  Enjin Coin
  Ravencoin
  0x Protocol
  Siacoin
  Basic Attention
  Ontology
  Zcash
Zcash  Decred
  Lisk
Lisk  Waves
Waves  DigiByte
  Status
  Numeraire
  Nano
Nano  Pax Dollar
  Steem
Steem  OMG Network
  BUSD
BUSD  Ren
Ren  Bytom
Bytom  Bitcoin Diamond
  HUSD
HUSD  Energi
  Augur
Augur