


Bitcoin Price At Significant Risk of Crash Below $25,400

Bitcoin price is struggling below the $26,150 support. BTC could start another decline if it breaks the key $25,400 support in the near term.
- Bitcoin is moving lower below the $26,150 support zone.
- The price is trading below $26,000 and the 100 hourly Simple moving average.
- There is a key bearish trend line forming with resistance near $26,000 on the hourly chart of the BTC/USD pair (data feed from Kraken).
- The pair could decline again if there is a move below the $25,400 support zone.
Bitcoin Price Remains In Downtrend
Bitcoin price struggled to settle above the $26,500 resistance zone. BTC declined below the $26,150 support to move into a bearish zone.
The recent high was formed near $26,133 and the price is now moving lower. There was a break below the 50% Fib retracement level of the upward move from the $25,400 swing low to the $26,133 high. The price also traded below the $25,750 support.
Bitcoin price is now trading below $26,000 and the 100 hourly Simple moving average. There is also a key bearish trend line forming with resistance near $26,000 on the hourly chart of the BTC/USD pair.
It seems to be holding the $25,570 support level. It is close to the 76.4% Fib retracement level of the upward move from the $25,400 swing low to the $26,133 high. Immediate resistance is near the $26,000 level and the trend line region.
The first major resistance is near the $26,150 level. A clear move above the $26,150 resistance might start a decent increase. The next major resistance is near the $26,500 level. A close above $26,500 might send the price further higher.
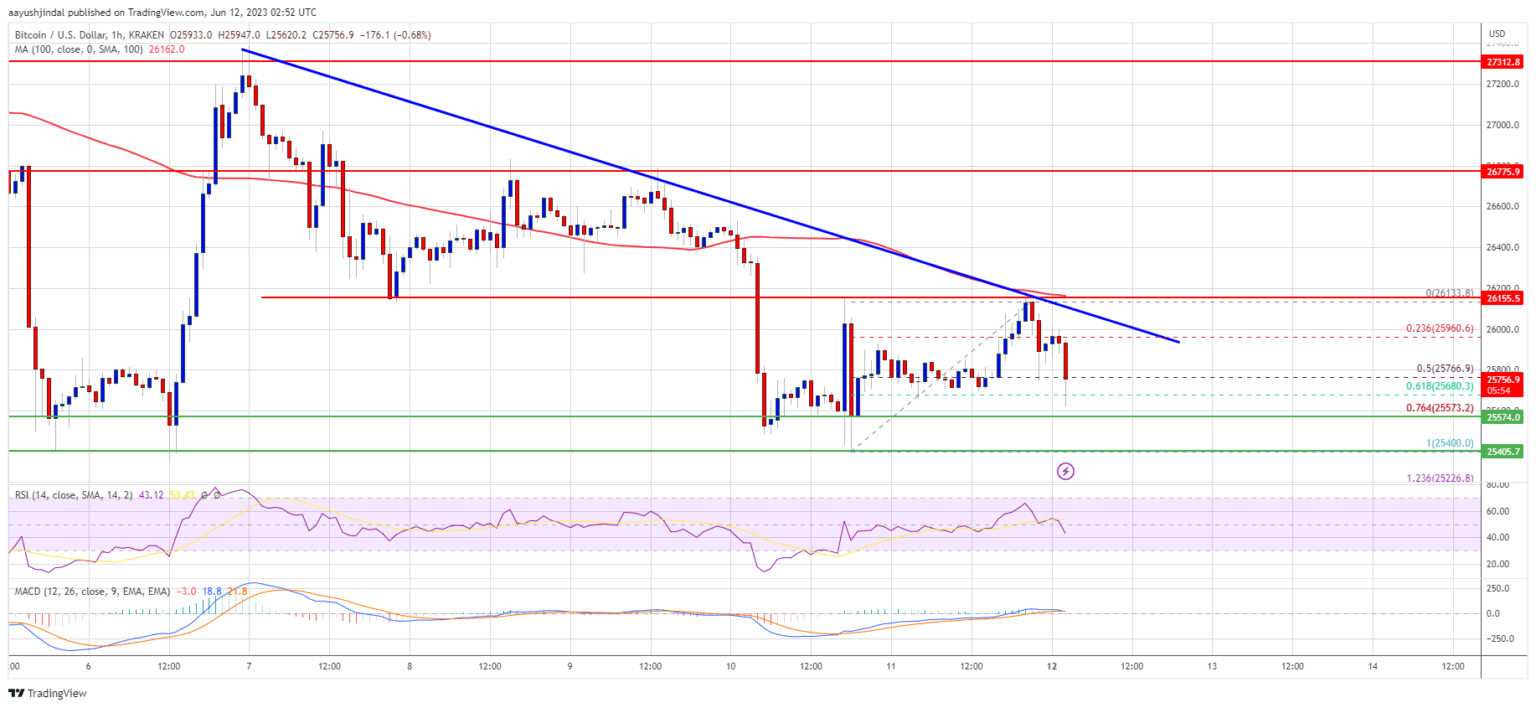
Source: BTCUSD on TradingView.com
The next key resistance is near the $27,000 level, above which Bitcoin might rise toward the $27,500 resistance. Any more gains above the $27,500 resistance zone might send the price toward the $28,500 resistance zone.
More Losses in BTC?
If Bitcoin’s price fails to clear the $26,000 resistance, it could continue to move down. another decline. Immediate support on the downside is near the $25,570 level.
The next major support is near the $25,400 level, below which the price might accelerate lower. In the stated case, the price could drop toward the $25,000 support in the near term.
Technical indicators:
Hourly MACD – The MACD is now gaining pace in the bearish zone.
Hourly RSI (Relative Strength Index) – The RSI for BTC/USD is below the 50 level.
Major Support Levels – $25,570, followed by $25,500.
Major Resistance Levels – $26,000, $26,150, and $26,500.


 Bitcoin
  Ethereum
  Tether
  USDC
USDC  Dogecoin
  Cardano
  Bitcoin Cash
  Polygon
  Litecoin
  LEO Token
  Hedera
  Stellar
  Cosmos Hub
  OKB
OKB  Maker
Maker  Algorand
  NEO
NEO  Gate
Gate  KuCoin
  Synthetix Network
  IOTA
IOTA  Tether Gold
  TrueUSD
  Holo
Holo  Enjin Coin
  0x Protocol
  Ravencoin
  Siacoin
  Basic Attention
  Ontology
  Zcash
Zcash  Decred
  Waves
Waves  Lisk
Lisk  DigiByte
  Nano
Nano  Status
  Numeraire
  Pax Dollar
  Steem
Steem  OMG Network
  BUSD
BUSD  Ren
Ren  Bytom
Bytom  Bitcoin Diamond
  HUSD
HUSD  Energi
  Augur
Augur