


Bitcoin Soars to $18K But How High Can it Continue? (BTC Price Analysis)
This week’s CPI announcement was a significant relief for Bitcoin investors, as declining inflation would likely lead to a bullish trend for risk assets. However, there is still room for caution from a technical analysis standpoint, as the price has yet to break any major resistance level.
Technical Analysis
By: Edris
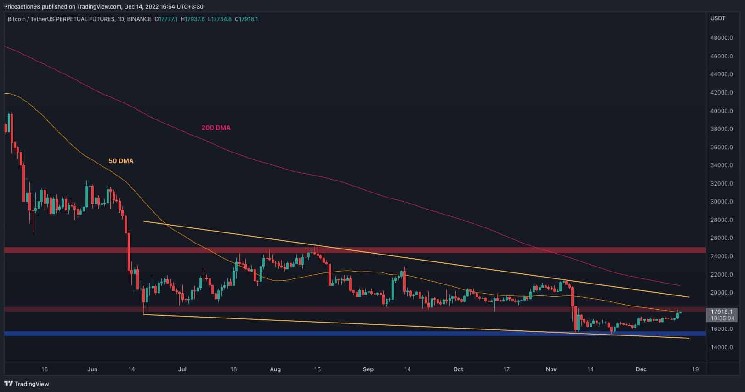
The Daily Chart
On the daily timeframe, the price has finally reached the $18K resistance area and is currently trying to break it to the upside. The 50-day moving average, located around the same price, is providing additional resistance at the moment.
It’s important to note that a bullish breakout from this significant resistance level could likely lead to a further rally towards the higher boundary of the large descending channel around the $20K mark.
In opposition, if the price gets rejected to the downside, a rapid decline toward the $15K support area would be probable, as there would be no obstacle to holding the price on this timeframe.

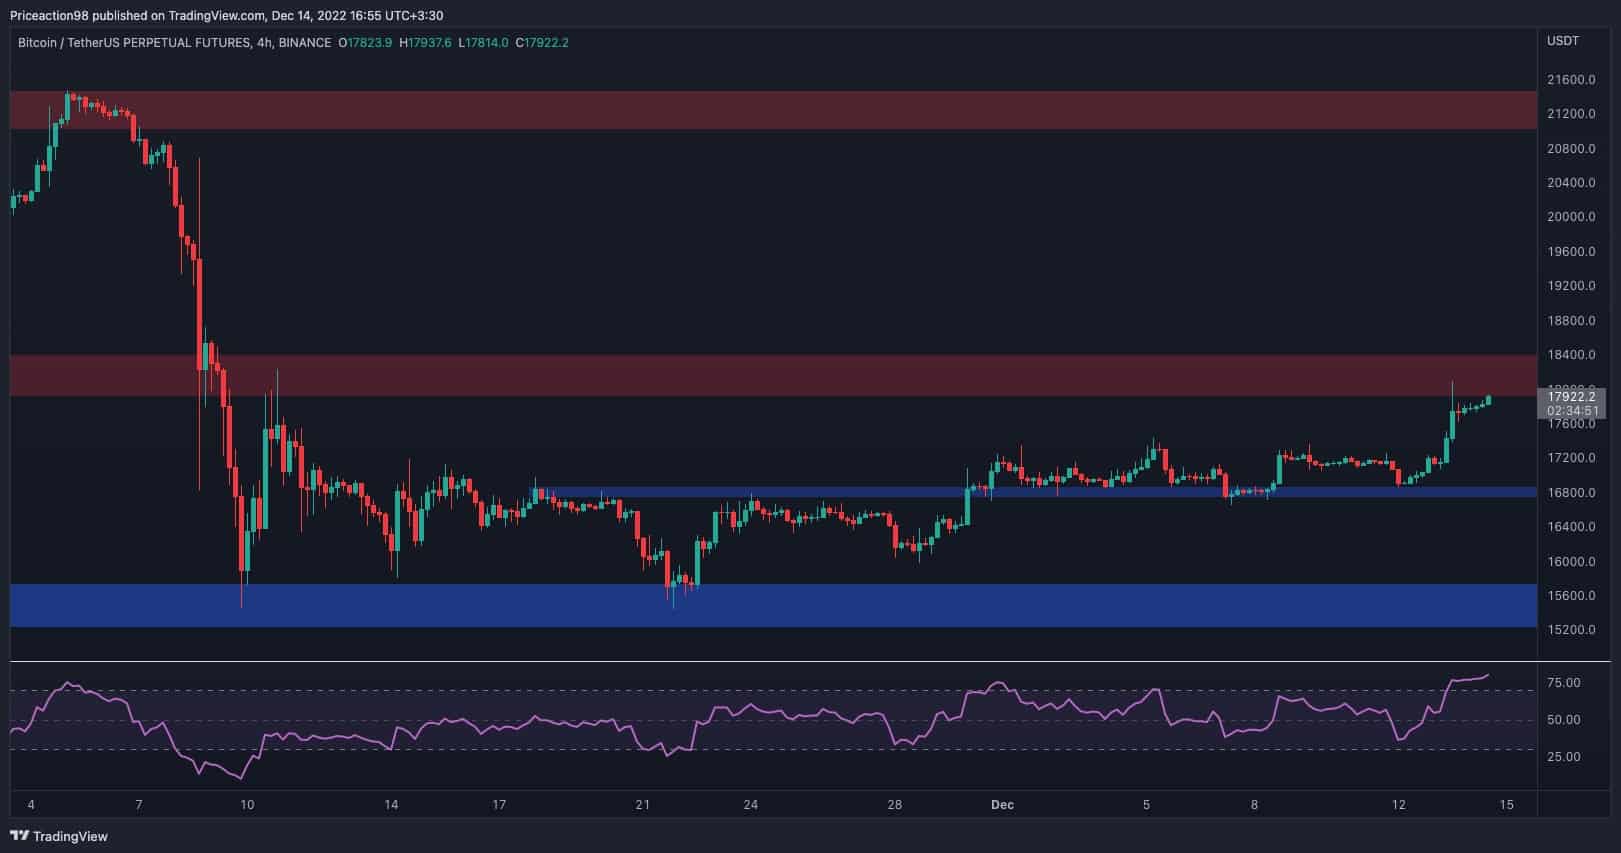
The 4-Hour Chart
Looking at the 4-hour chart, the price has finally broken above the $17K mark and is testing the $18K resistance. A breakout from the mentioned level could pave the way for a surge toward $21K in the short term.
However, the RSI indicator is already showcasing a red flag, as the indicator is deep into the overbought area, currently trending around the 80% mark. This signal could point to a pullback or bearish reversal in the coming days, leading to a likely retest of the $17K area.
Considering the relatively high likelihood for the Feds to ease back on the rate hikes and the price’s recent bullish momentum, a breakout above $18K would be the more probable outcome.
The RSI overbought signal should not be taken lightly, especially until the price still trades below the mentioned $18K resistance level.


 Bitcoin
  Ethereum
  Tether
  USDC
USDC  Dogecoin
  Cardano
  Bitcoin Cash
  Polygon
  Litecoin
  LEO Token
  Hedera
  Cosmos Hub
  Stellar
  OKB
OKB  Maker
Maker  Algorand
  NEO
NEO  Gate
Gate  KuCoin
  Synthetix Network
  IOTA
IOTA  Tether Gold
  TrueUSD
  Enjin Coin
  Holo
Holo  Ravencoin
  0x Protocol
  Siacoin
  Basic Attention
  Zcash
Zcash  Decred
  Ontology
  Lisk
Lisk  Waves
Waves  DigiByte
  Numeraire
  Nano
Nano  Status
  Pax Dollar
  Steem
Steem  OMG Network
  BUSD
BUSD  Ren
Ren  Bitcoin Diamond
  Bytom
Bytom  Energi
  HUSD
HUSD  Augur
Augur